Fig. 3
Download original image
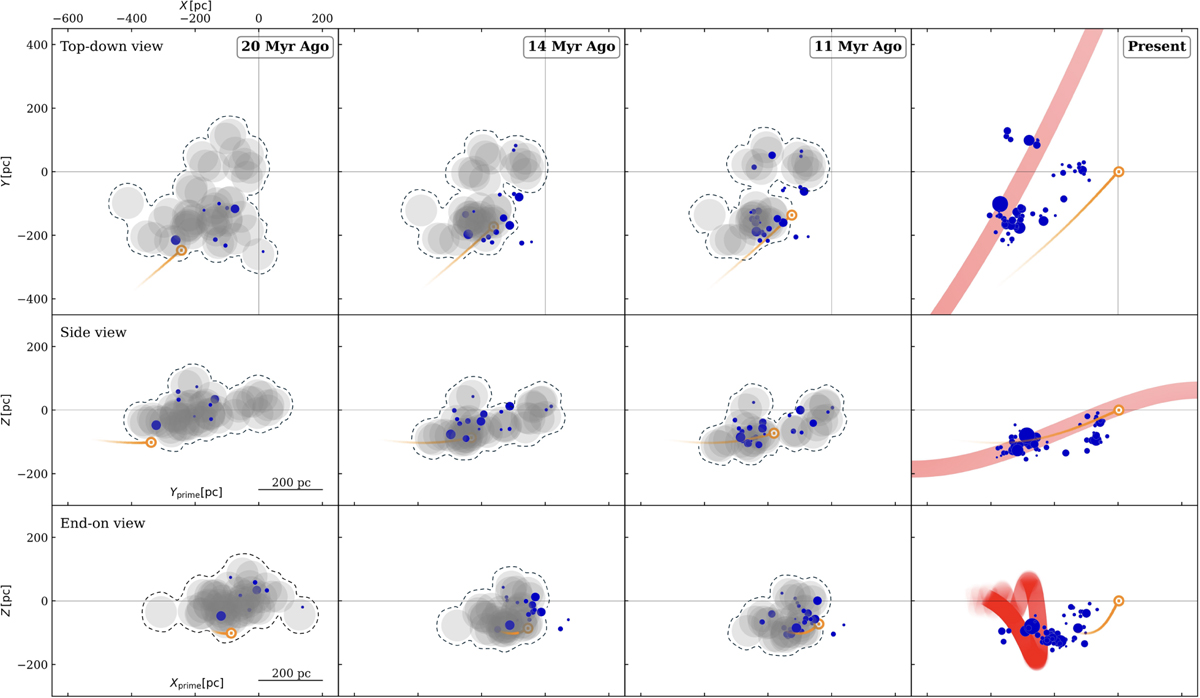
Selected time snapshots for the tracebacks of the orbits of the Sun, selected clusters, and relative parental clouds. In the columns from left to right, we depict the Sun approaching the Radcliffe wave (t = 20 Myr ago), the Sun within the gas of the Radcliffe wave (t = 14 Myr ago), the Sun after it exited this gas structure (t = 11 Myr ago), and the present day situation (t = Present), respectively. The panels in the first row illustrate a top-down projection, while those in the second and third rows show side and end-on views, respectively, as depicted in Fig. 1. The Sun is denoted by a golden-yellow ⊙, and its trail is represented by dotted points with decreasing opacity. The analyzed clusters are indicated as blue circles, whose sizes are proportional to the number of their stellar members. Clusters prior to their birth are represented by light-gray circles, symbolizing 50 pc radius gas clouds. We enclosed the clouds with a dashed black line to highlight the larger gas complex they are part of. The best-fit model (Konietzka et al. 2024) of the Radcliffe wave is shown as a light-red band in the present day panels. An online 3D animation is available here, viewable from any angle and at any time step over the past 30 Myr.
Current usage metrics show cumulative count of Article Views (full-text article views including HTML views, PDF and ePub downloads, according to the available data) and Abstracts Views on Vision4Press platform.
Data correspond to usage on the plateform after 2015. The current usage metrics is available 48-96 hours after online publication and is updated daily on week days.
Initial download of the metrics may take a while.