Fig. 2
Download original image
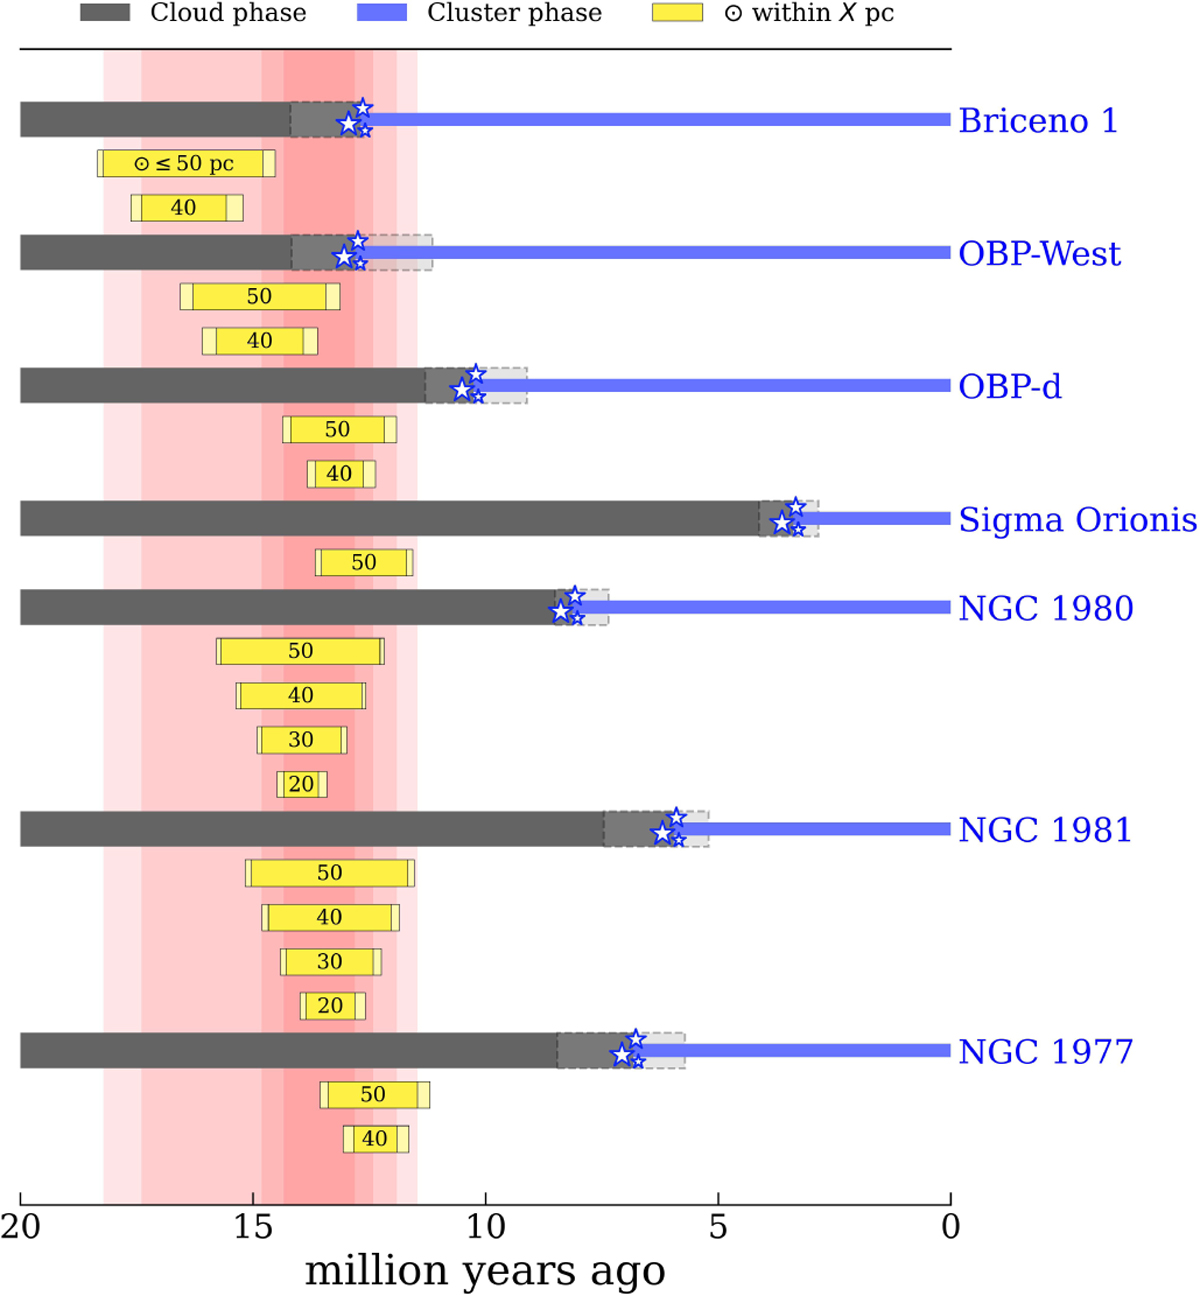
Significant encounters between the Solar System and the clusters of the Radcliffe wave during their cloud phase in the past 30 Myr, considering various threshold distances (dSun–cloud ; 50, 40, 30, and 20 pc). For each cluster, the cloud phase is represented by a horizontal gray band, the moment at which the cluster is formed is highlighted by three small stars, and the time period during which the cluster is fully formed (gas free phase) is denoted by a blue band. The age range of the cluster, as computed in this work, is indicated by a light-gray band with a dashed edge. The yellow bands highlight the time period during which the Solar System is within a certain distance from the clouds. Light-yellow represents the statistical uncertainty of the crossing times, as computed from the tracebacks. The vertical red stripes summarize the time range during which the Solar System is passing through the gaseous part of the Radcliffe wave. The closer the transit, the redder the vertical stripe. The numerical equivalent of this plot is reported in Table 1.
Current usage metrics show cumulative count of Article Views (full-text article views including HTML views, PDF and ePub downloads, according to the available data) and Abstracts Views on Vision4Press platform.
Data correspond to usage on the plateform after 2015. The current usage metrics is available 48-96 hours after online publication and is updated daily on week days.
Initial download of the metrics may take a while.