Fig. 1
Download original image
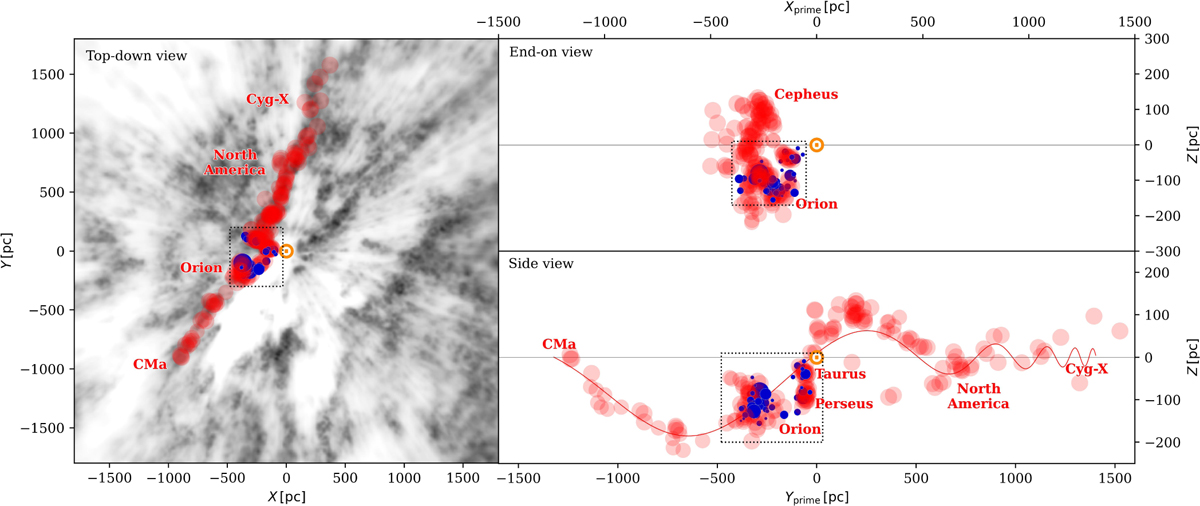
Overview of the Radcliffe wave and selected clusters, in a heliocentric Galactic Cartesian frame. The Sun is placed at the center and its position is marked with a golden-yellow ⊙. The red dots denote the molecular clouds and tenuous gas bridge connections that constitute the Radcliffe wave (Zucker et al. 2019; Alves et al. 2020). The blue points represent the 56 open clusters associated with the region of the Radcliffe wave that is relevant for this study. The size of the circles is proportional to the number of stars in the clusters. In the XY-plane on the left panel, the gray scale represents a dust map (Vergely et al. 2022) of the solar neighborhood integrated over the ɀ-axis. To properly visualize the Radcliffe wave’s structure, the XY-plane has been rotated counterclockwise by 120° for the ZXprime -plane (top-right panel) and by 30° for the ZYprime-plane (bottom-right panel), for an observer facing the Galactic anticenter. In the ZYprime-plane, the red-solid line represents the Radcliffe wave’s best fit model (Konietzka et al. 2024).
Current usage metrics show cumulative count of Article Views (full-text article views including HTML views, PDF and ePub downloads, according to the available data) and Abstracts Views on Vision4Press platform.
Data correspond to usage on the plateform after 2015. The current usage metrics is available 48-96 hours after online publication and is updated daily on week days.
Initial download of the metrics may take a while.