Open Access
Fig. 9.
Download original image
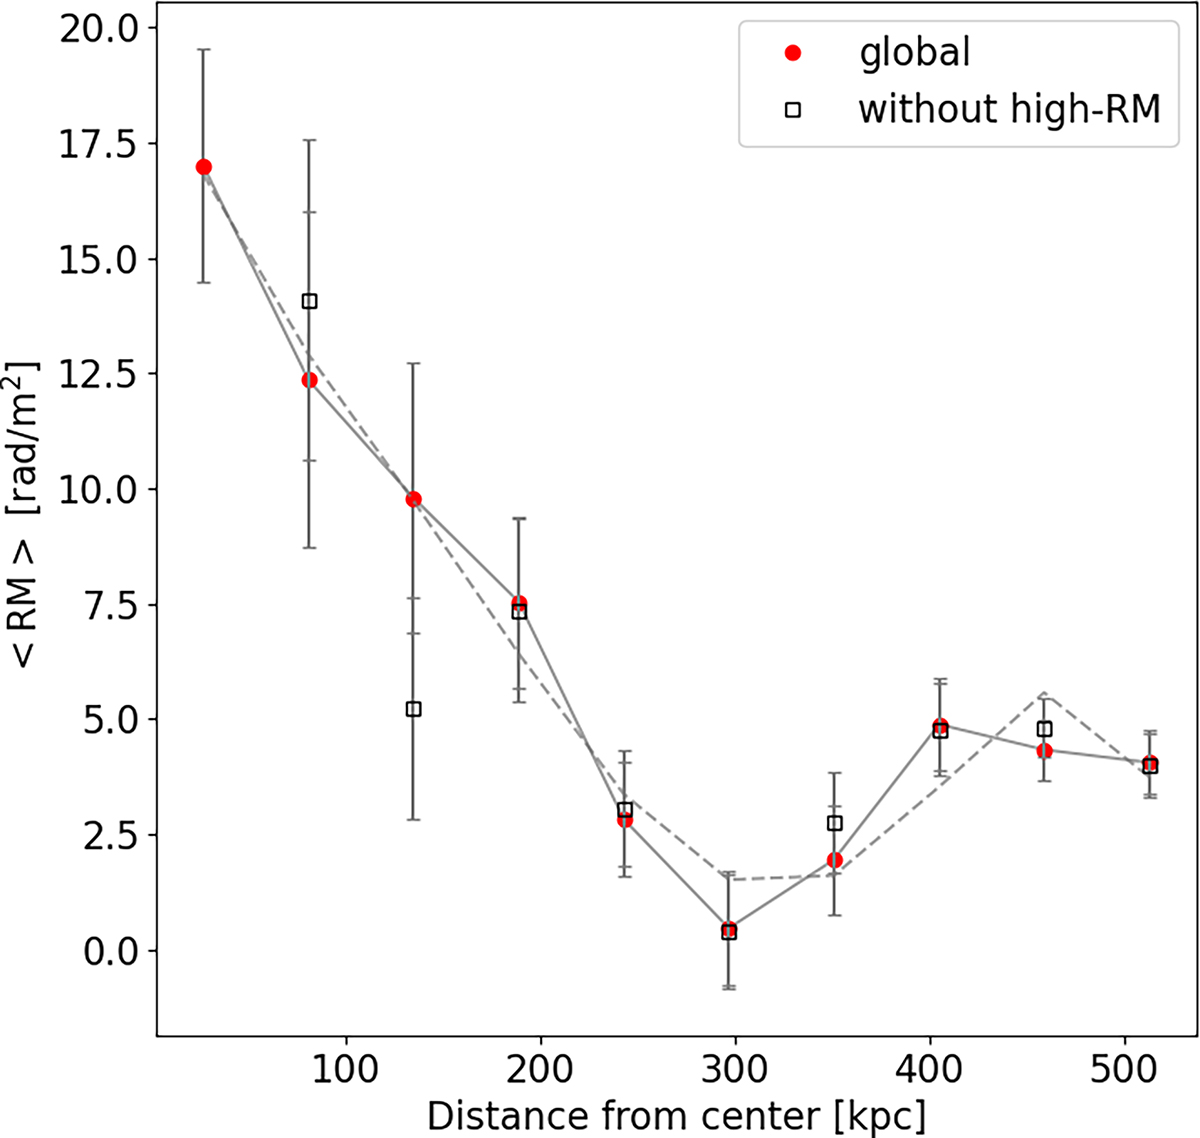
Radial profiles of the RM mean computed in annuli centred on the cluster center with a width of 8.5′ (51 kpc). Red dots refer to the RM average considering all the sources, while the empty black squares exclude the sources belonging to the high-RM stripe.
Current usage metrics show cumulative count of Article Views (full-text article views including HTML views, PDF and ePub downloads, according to the available data) and Abstracts Views on Vision4Press platform.
Data correspond to usage on the plateform after 2015. The current usage metrics is available 48-96 hours after online publication and is updated daily on week days.
Initial download of the metrics may take a while.