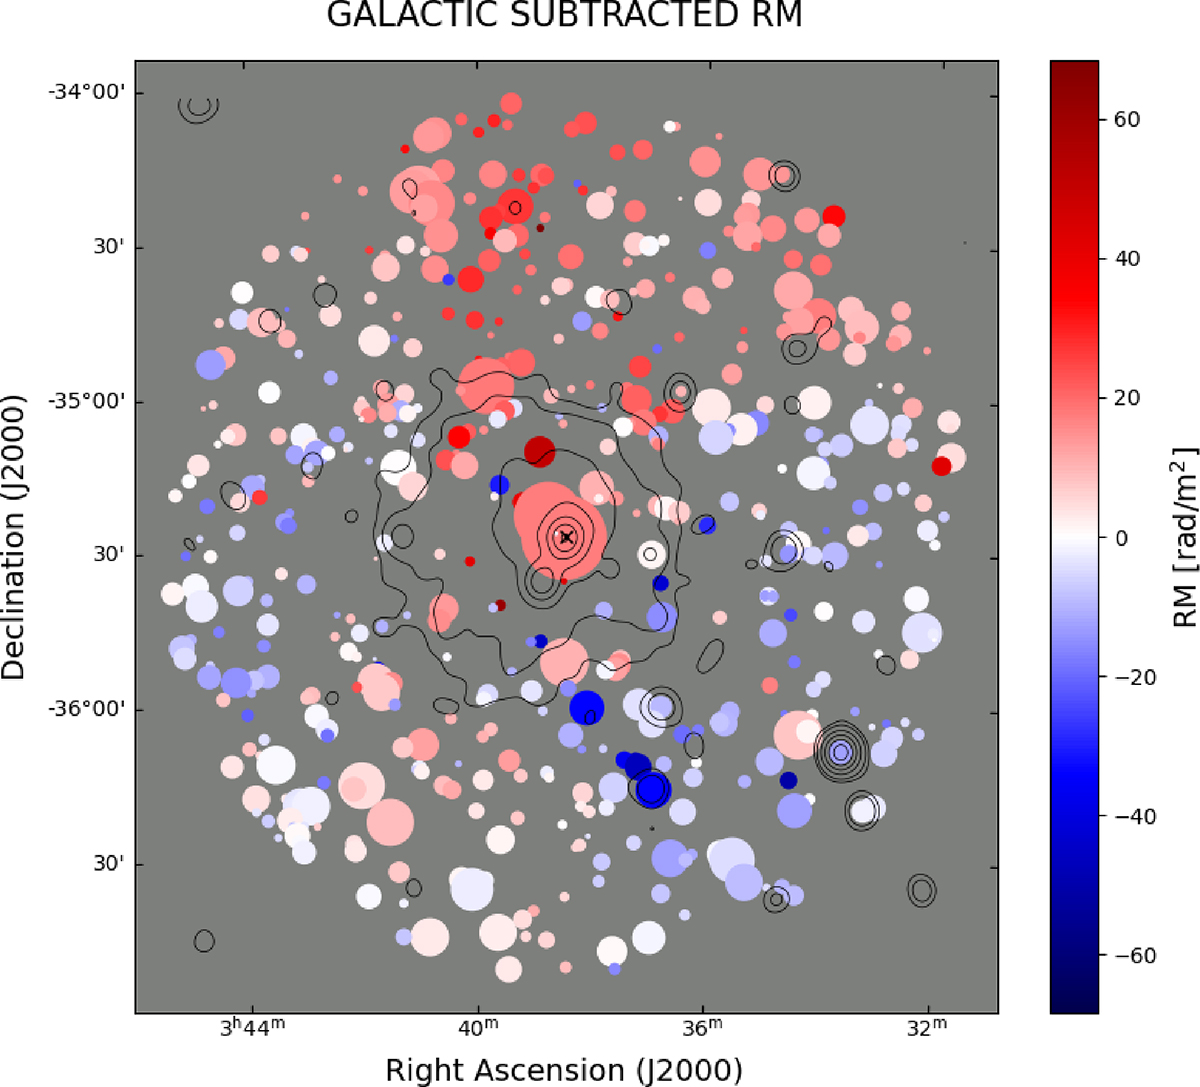
Fig. 7.
Download original image
Rotation measure grid after the subtraction of the Galactic RM Anderson et al. (2021). The images are centered on the Fornax cluster center and go down to a radius of 1.42 deg. Each circle represents a source with the area proportional to the source area, color-coded according to its average RM. The contours refer to the 0.2–2.3 keV e-ROSITA surface brightness image (smoothed at 5′) and start at 3σ with σ = 0.072 counts s−1deg−2 and scale with ![]() .
.
Current usage metrics show cumulative count of Article Views (full-text article views including HTML views, PDF and ePub downloads, according to the available data) and Abstracts Views on Vision4Press platform.
Data correspond to usage on the plateform after 2015. The current usage metrics is available 48-96 hours after online publication and is updated daily on week days.
Initial download of the metrics may take a while.