Fig. 6.
Download original image
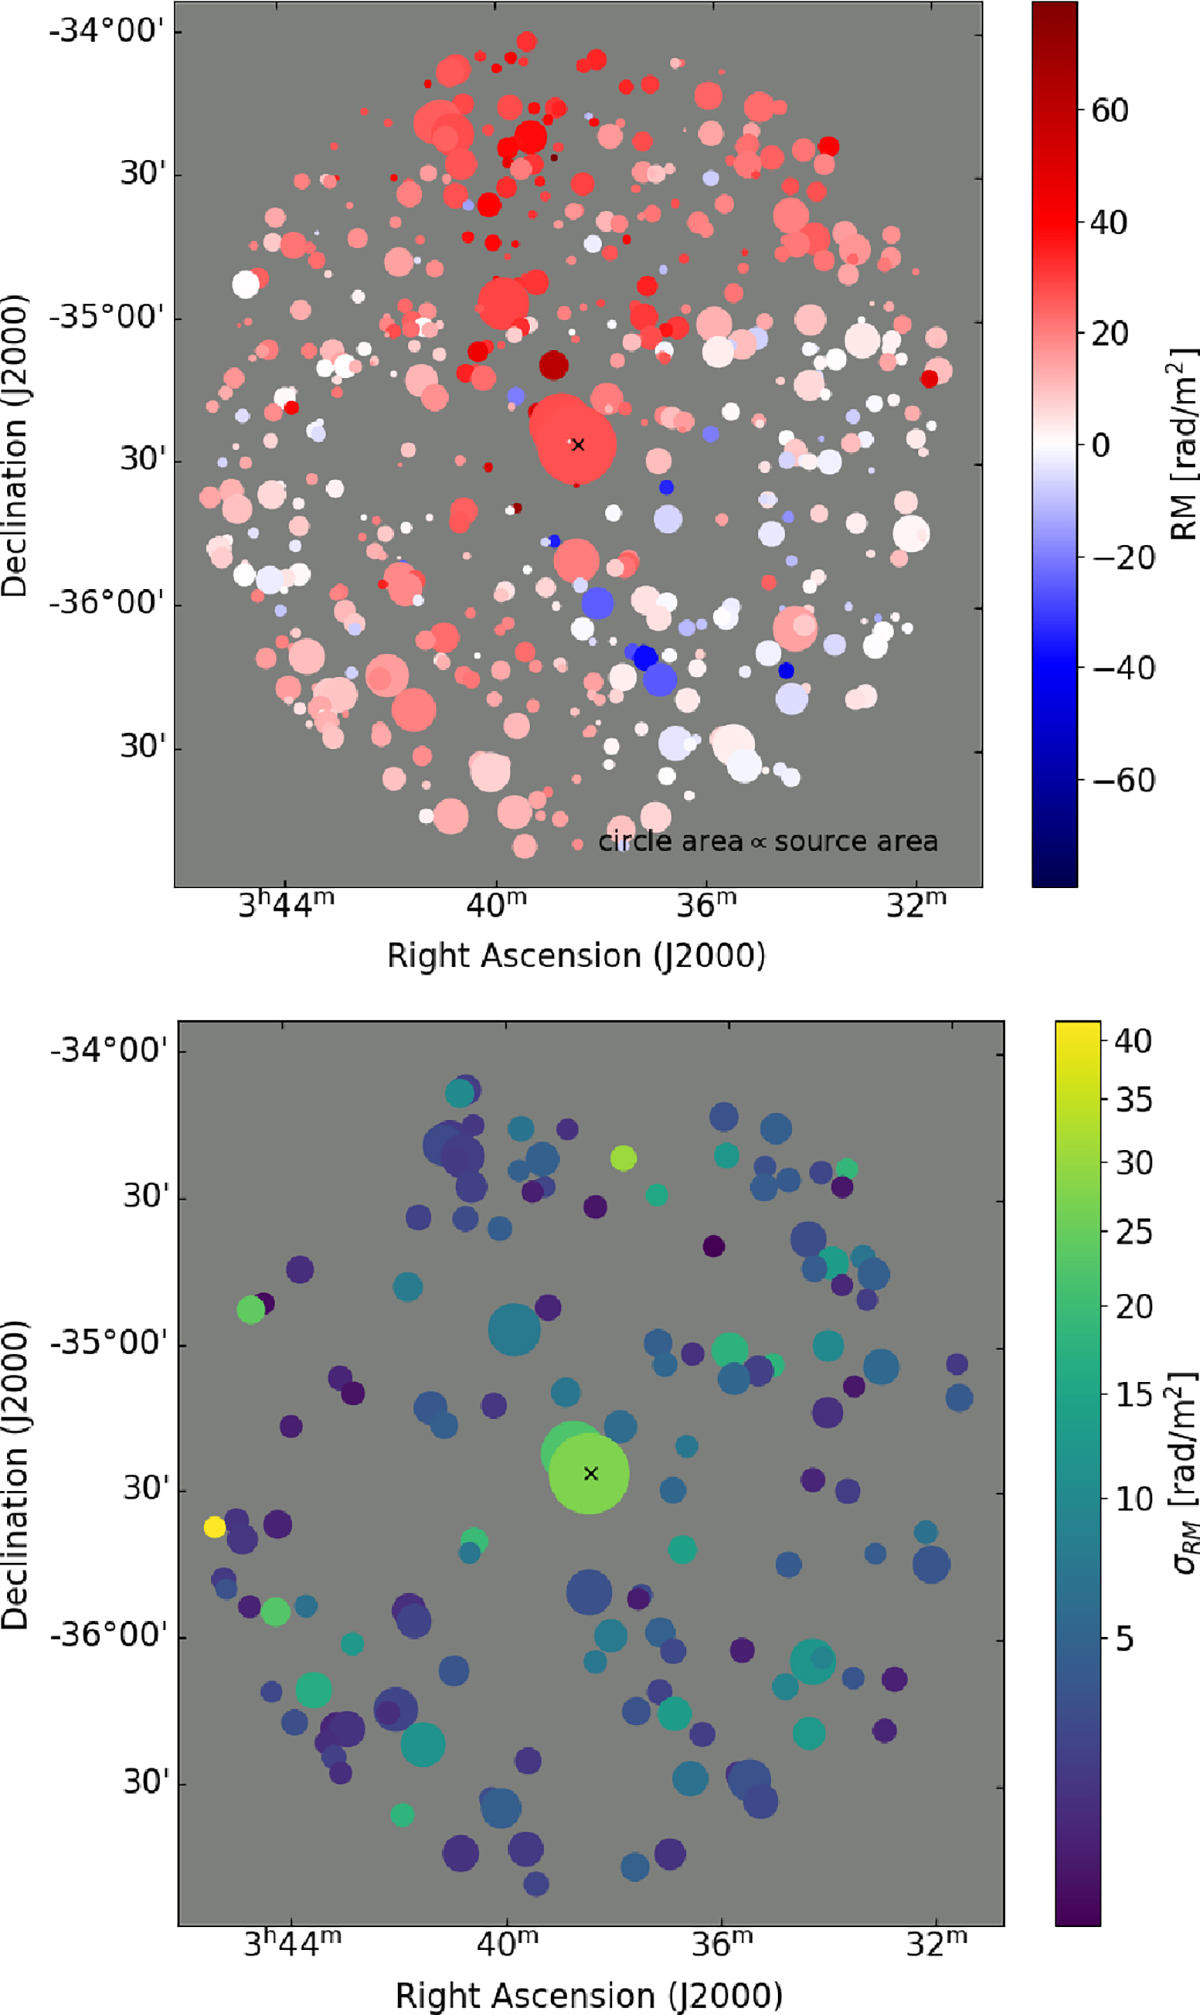
Rotation measure grid evaluated from the MeerKAT Fornax Survey broadband data between 900 MHz and 1.4 GHz. The image is centered on the Fornax cluster center and goes out to a radius of 1.42 deg. Each circle represents a source with the area proportional to the source area. Top: RM mean per source. Bottom: RM standard deviation per source considering sources with cover at least three times the beam area.
Current usage metrics show cumulative count of Article Views (full-text article views including HTML views, PDF and ePub downloads, according to the available data) and Abstracts Views on Vision4Press platform.
Data correspond to usage on the plateform after 2015. The current usage metrics is available 48-96 hours after online publication and is updated daily on week days.
Initial download of the metrics may take a while.