Fig. 5.
Download original image
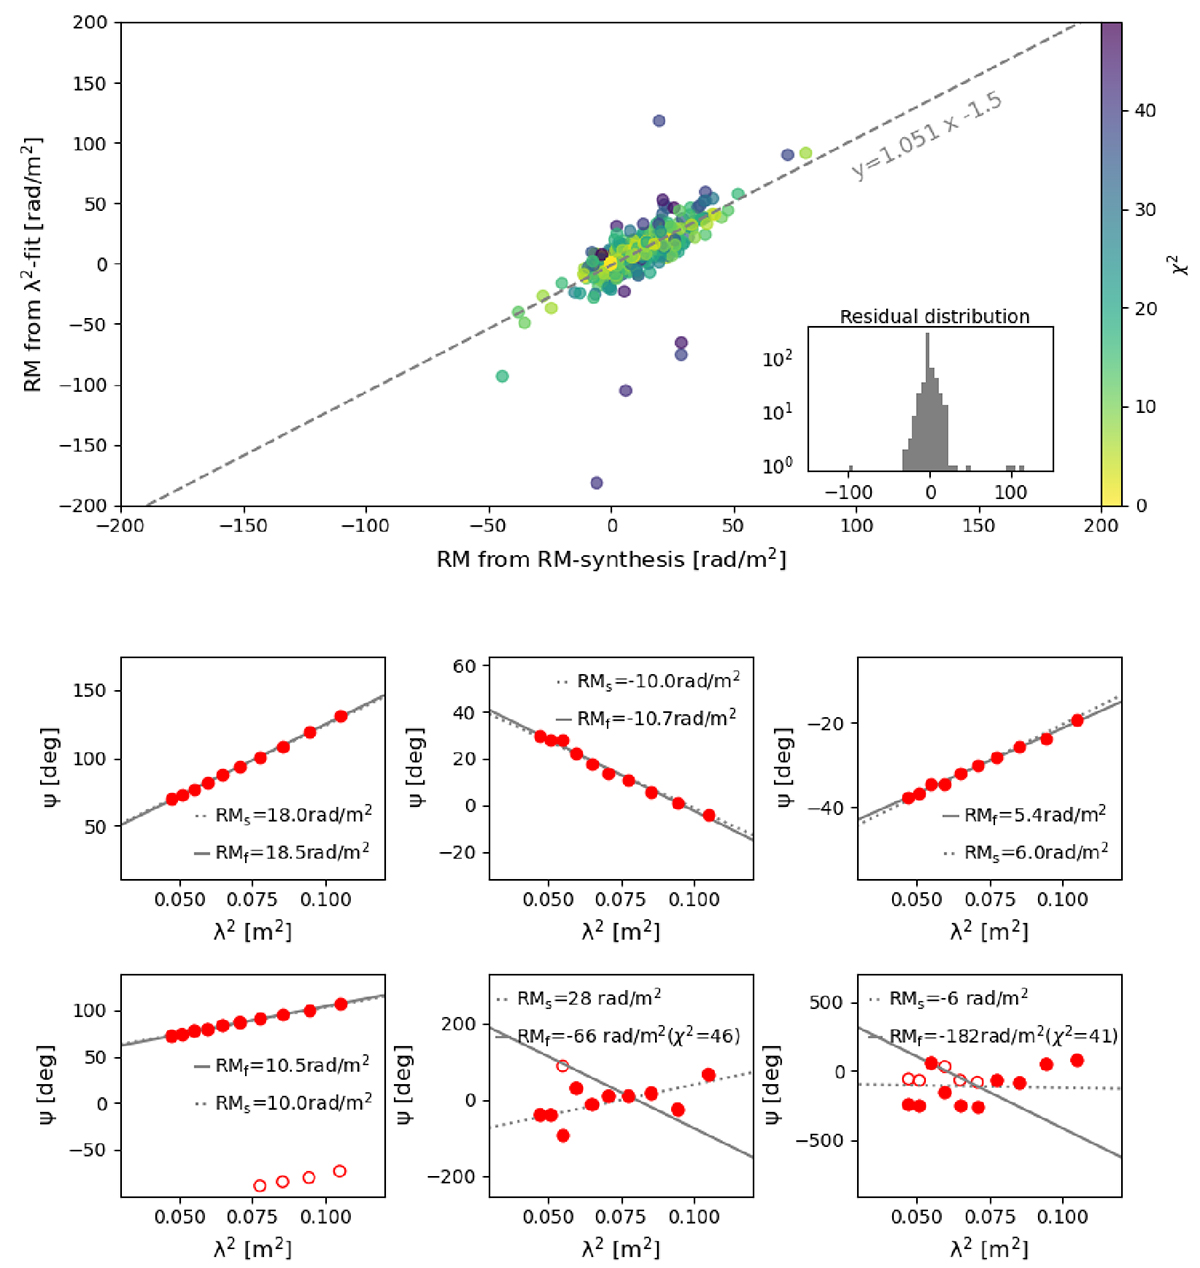
Faraday complexity analysis. Top: Comparison between the RM derived with the RM synthesis (x axis) and the λ2-fit techniques applied to the entire mosaic. Each point is the RM at the polarized surface brightness peak of each source. The points are color-coded according to the reduced χ2 of the λ2-fit. The bottom right inset shows a histogram of the residuals. Middle and bottom: The red points show the polarized angle as a function of λ2. The empty and filled points are, respectively, the observed and the nπ-ambiguity-corrected points. In each plot, the results of the RM synthesis and of the λ2-fitting techniques are reported as dotted and solid lines, respectively. The RM values are also reported in each plot with the value of the reduced χ2 when larger than 1.
Current usage metrics show cumulative count of Article Views (full-text article views including HTML views, PDF and ePub downloads, according to the available data) and Abstracts Views on Vision4Press platform.
Data correspond to usage on the plateform after 2015. The current usage metrics is available 48-96 hours after online publication and is updated daily on week days.
Initial download of the metrics may take a while.