Fig. 4.
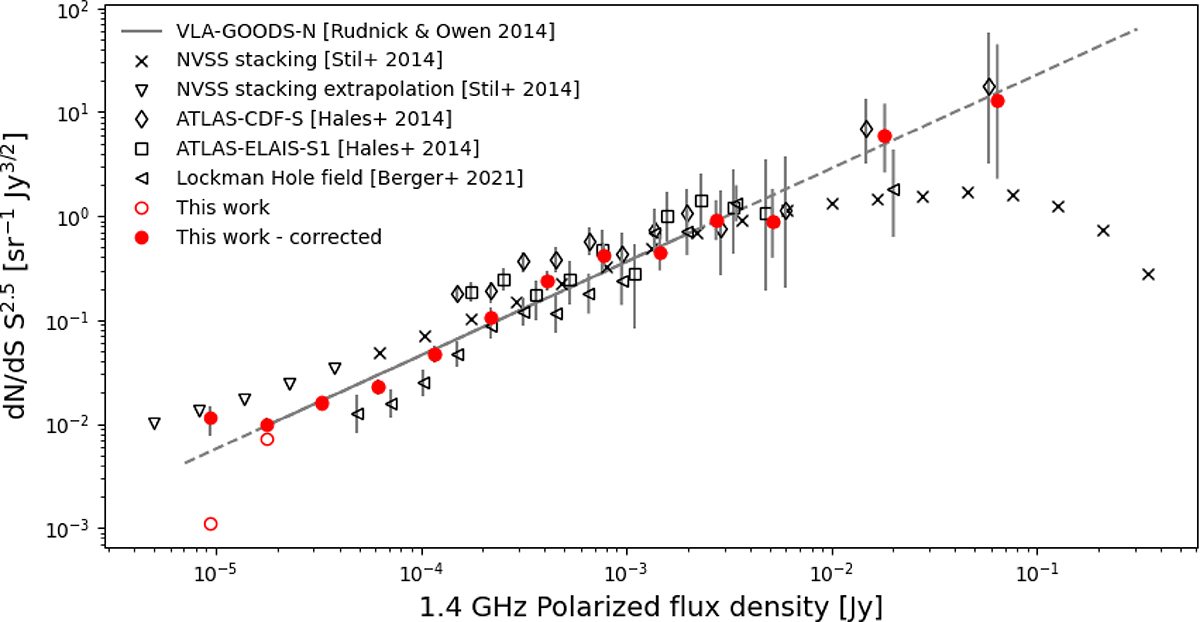
Download original image
Euclidian-normalized differential source counts at 1.4 GHz in polarized intensity from our survey (red circles). We also show the data taken from Rudnick & Owen (2014) (the solid line represents the function fitted on the VLA-GOODS-N field data, the extrapolation at lower and higher polarized flux densities is shown as dashed line), Hales et al. (2014) (diamonds and squares refer to the ATLAS-CDF-S and the ATLAS-ELAIS-S1 fields, respectively), Berger et al. (2021) (left-facing triangles for the Lockman Hole field), Stil et al. (2014) (crosses for the stacking of the NVSS sources and downward-pointing triangles for the extrapolation at lower polarized flux densities).
Current usage metrics show cumulative count of Article Views (full-text article views including HTML views, PDF and ePub downloads, according to the available data) and Abstracts Views on Vision4Press platform.
Data correspond to usage on the plateform after 2015. The current usage metrics is available 48-96 hours after online publication and is updated daily on week days.
Initial download of the metrics may take a while.