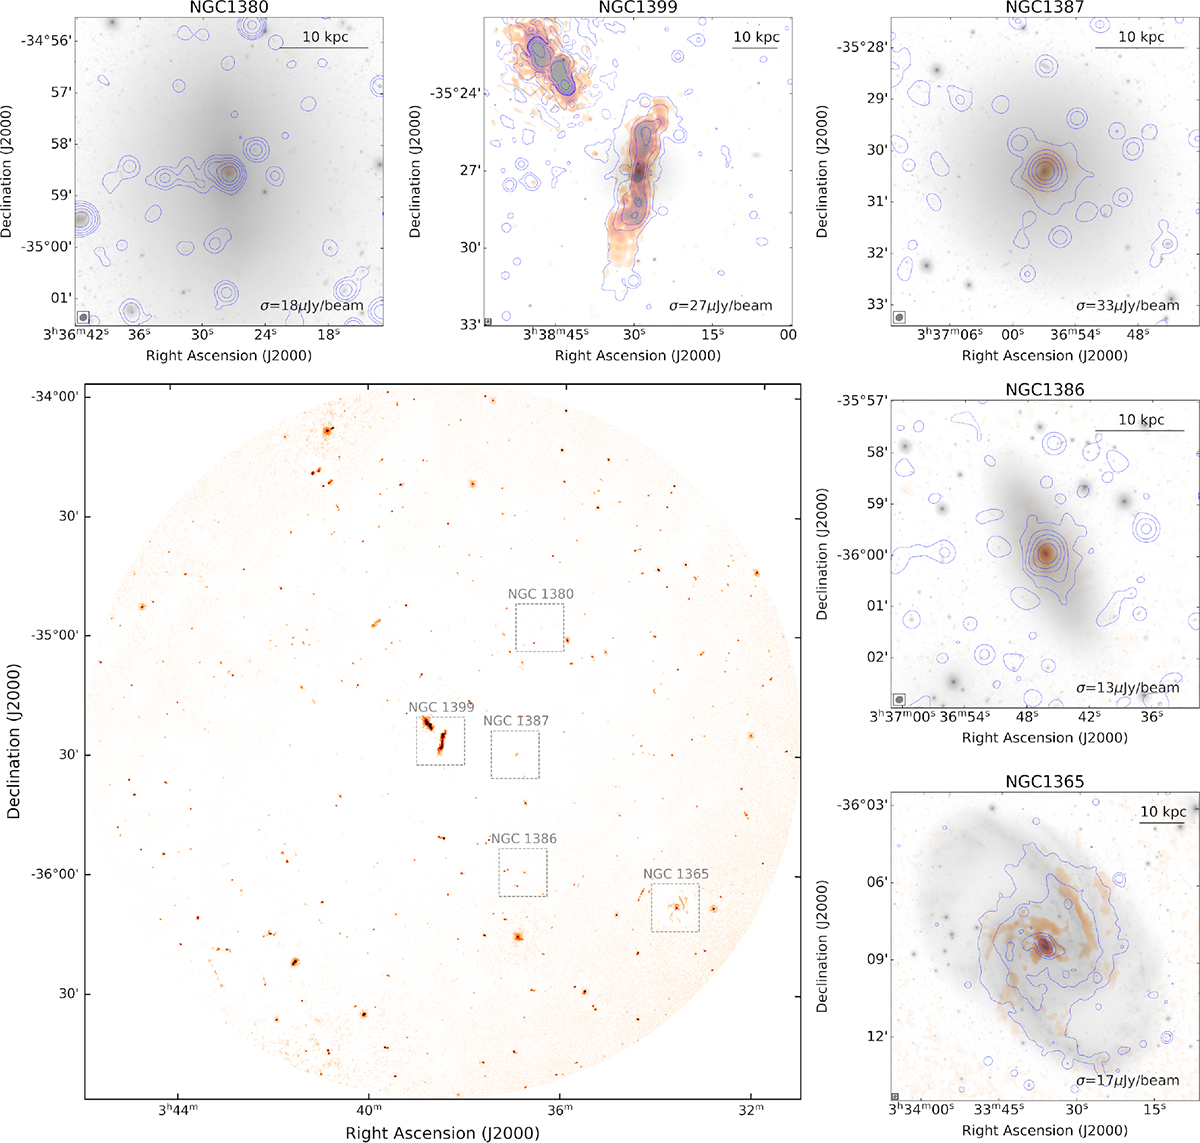
Fig. 2.
Download original image
Polarized intensity after the application of the RM synthesis and the removal of the positive bias obtained between 900 MHz and 1.4 GHz. The resolution is 13″. The zoomed images around the bottom left image are centered on the five polarized cluster sources. For each of them, we show the optical image from the Fornax Deep Survey in gray scale and the total intensity contours starting from 3σ, whose value is reported in the bottom right corner of the image, and increasing on a logarithmic scale.
Current usage metrics show cumulative count of Article Views (full-text article views including HTML views, PDF and ePub downloads, according to the available data) and Abstracts Views on Vision4Press platform.
Data correspond to usage on the plateform after 2015. The current usage metrics is available 48-96 hours after online publication and is updated daily on week days.
Initial download of the metrics may take a while.