Open Access
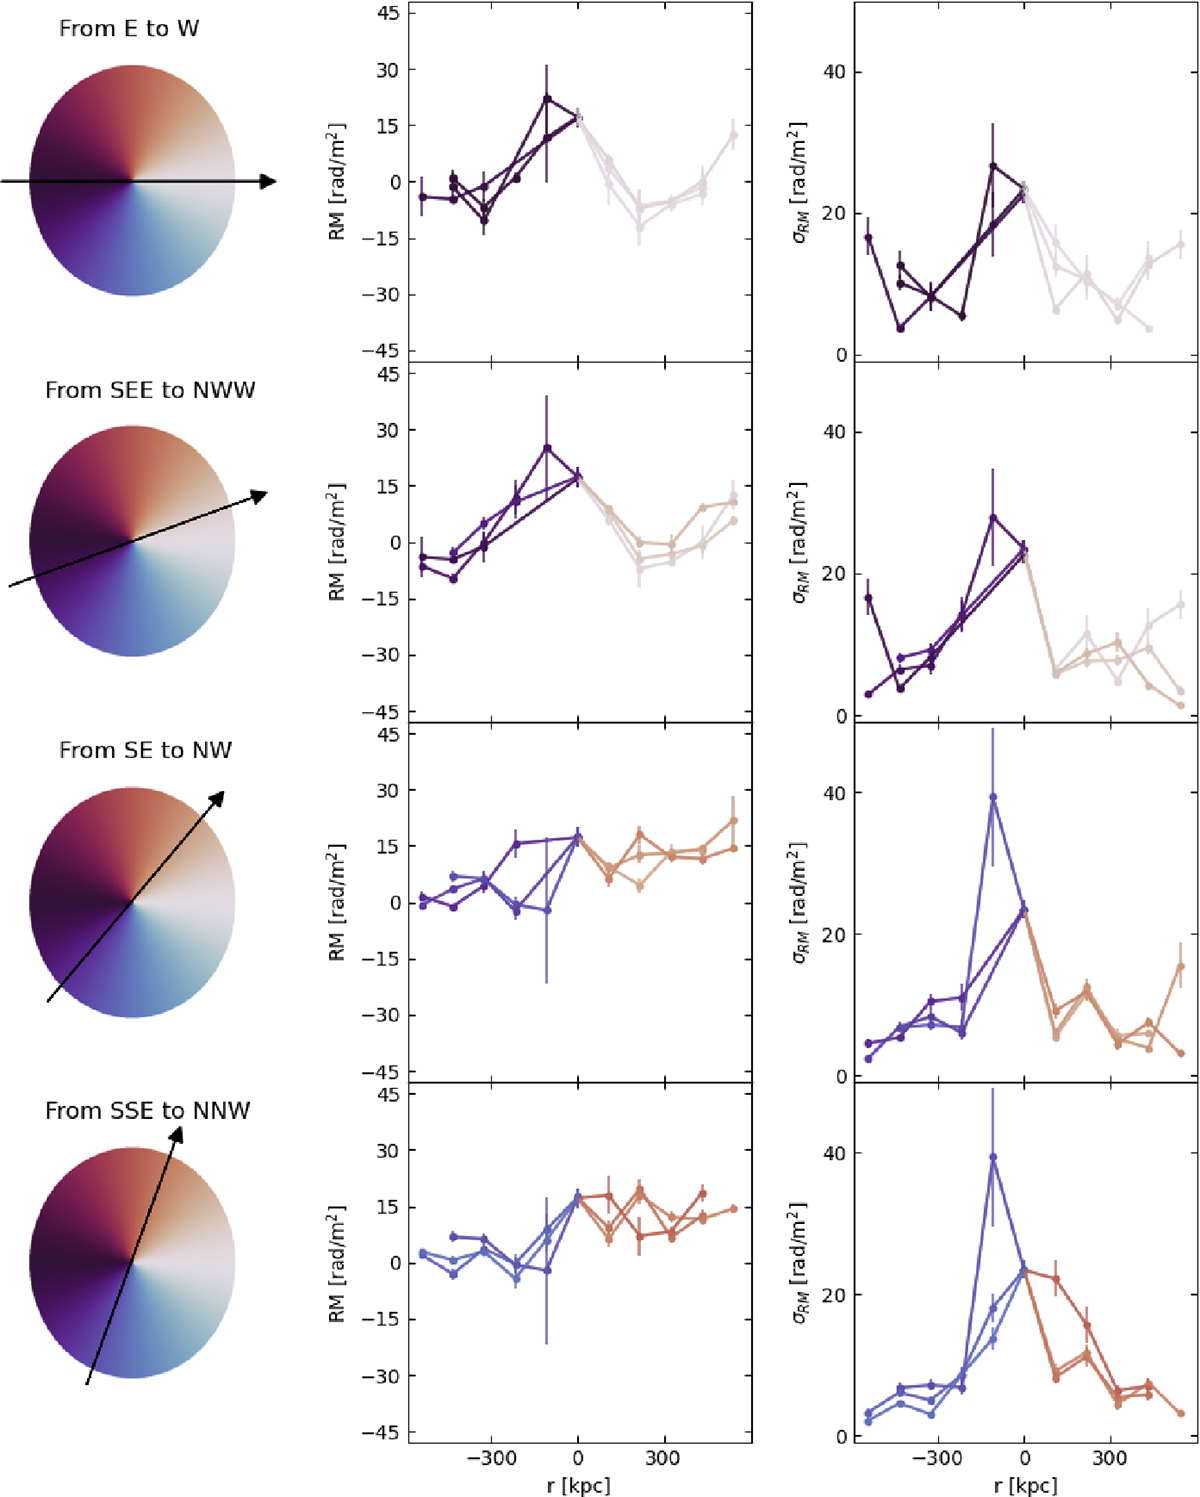
Fig. C.2.
Download original image
RM trend across several directions. Column 1 shows the color bar for crossing direction (black arrow). Columns 2-3 show the mean and standard deviation RM across the corresponding direction and ±10°, computed in 18′ square boxes.
Current usage metrics show cumulative count of Article Views (full-text article views including HTML views, PDF and ePub downloads, according to the available data) and Abstracts Views on Vision4Press platform.
Data correspond to usage on the plateform after 2015. The current usage metrics is available 48-96 hours after online publication and is updated daily on week days.
Initial download of the metrics may take a while.