Fig. 5.

Download original image
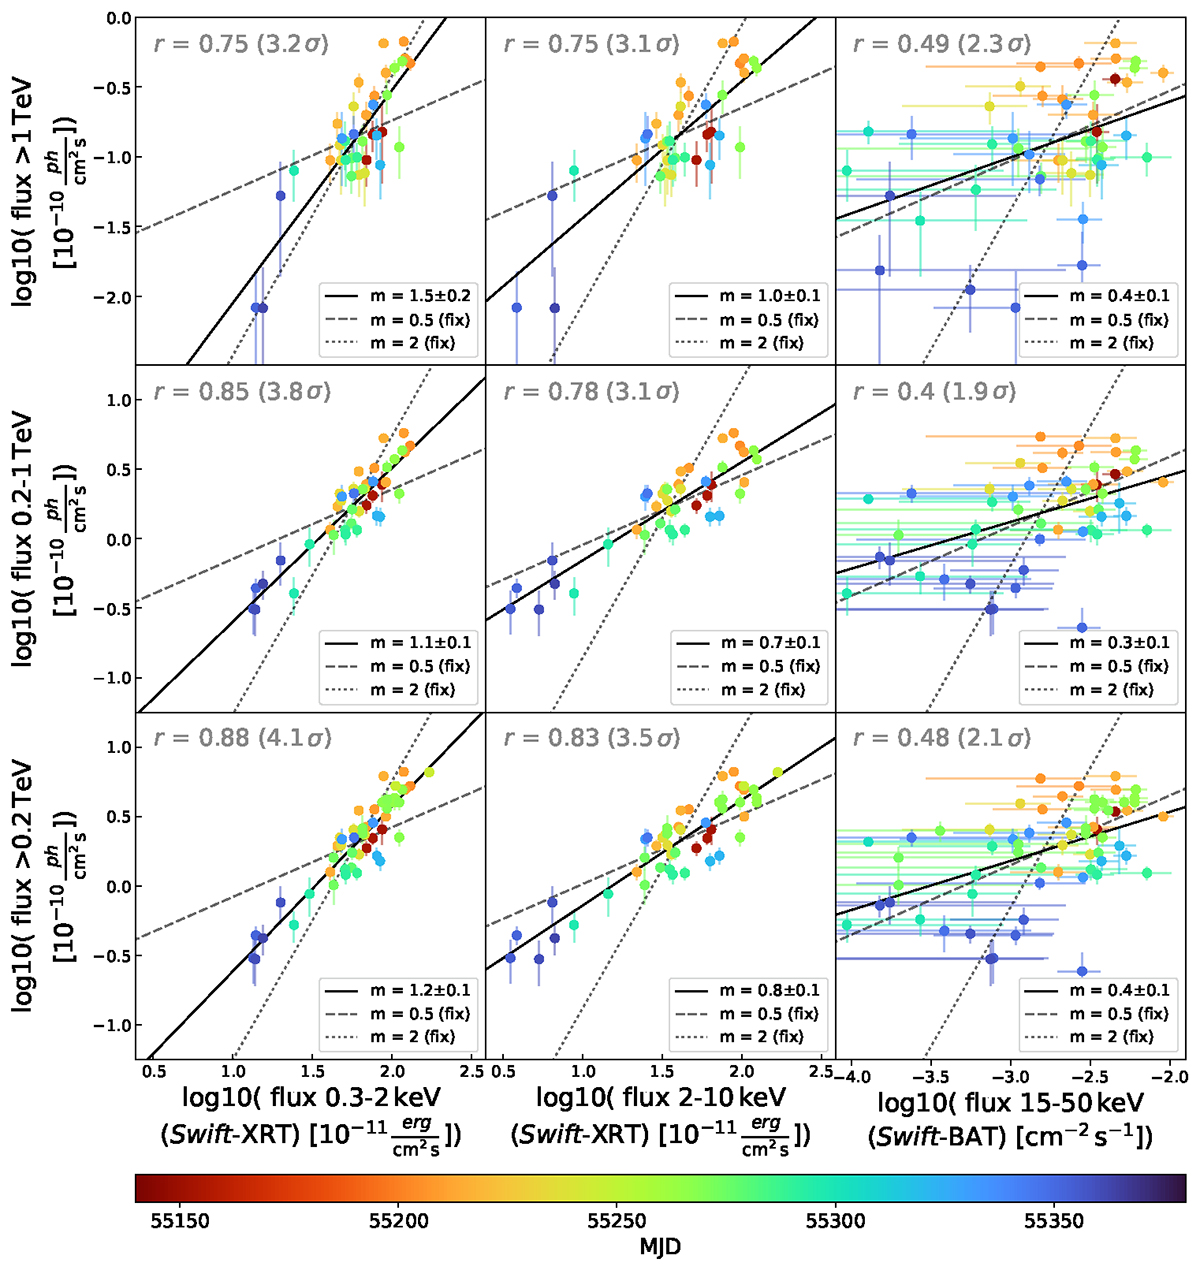
VHE flux versus X-ray flux obtained by MAGIC/VERITAS and Swift-XRT/BAT. Only pairs of observations within 6 hours are considered. If more than one Swift observation falls within that window, the weighted mean is computed. VHE fluxes are in the > 1 TeV band (top panels), in the 0.2−1 TeV band (middle panels), and in the > 0.2 TeV band (bottom panels). Swift-XRT fluxes are computed in the 0.3−2 keV (left panels) and 2−10 keV bands (middle panels). Swift-BAT provides the flux in the 15−50 keV band (right panels). The top left corner of each panel shows the Pearson coefficient of the flux pairs, with the significance of the correlations given in parentheses. The gray dashed and dotted lines depict a fit with slope fixed to 0.5 and 2, respectively, and the black line is the best-fit line to the data, with the slope quoted in the legend at the bottom right of each panel.
Current usage metrics show cumulative count of Article Views (full-text article views including HTML views, PDF and ePub downloads, according to the available data) and Abstracts Views on Vision4Press platform.
Data correspond to usage on the plateform after 2015. The current usage metrics is available 48-96 hours after online publication and is updated daily on week days.
Initial download of the metrics may take a while.


