Fig. 4.
Download original image
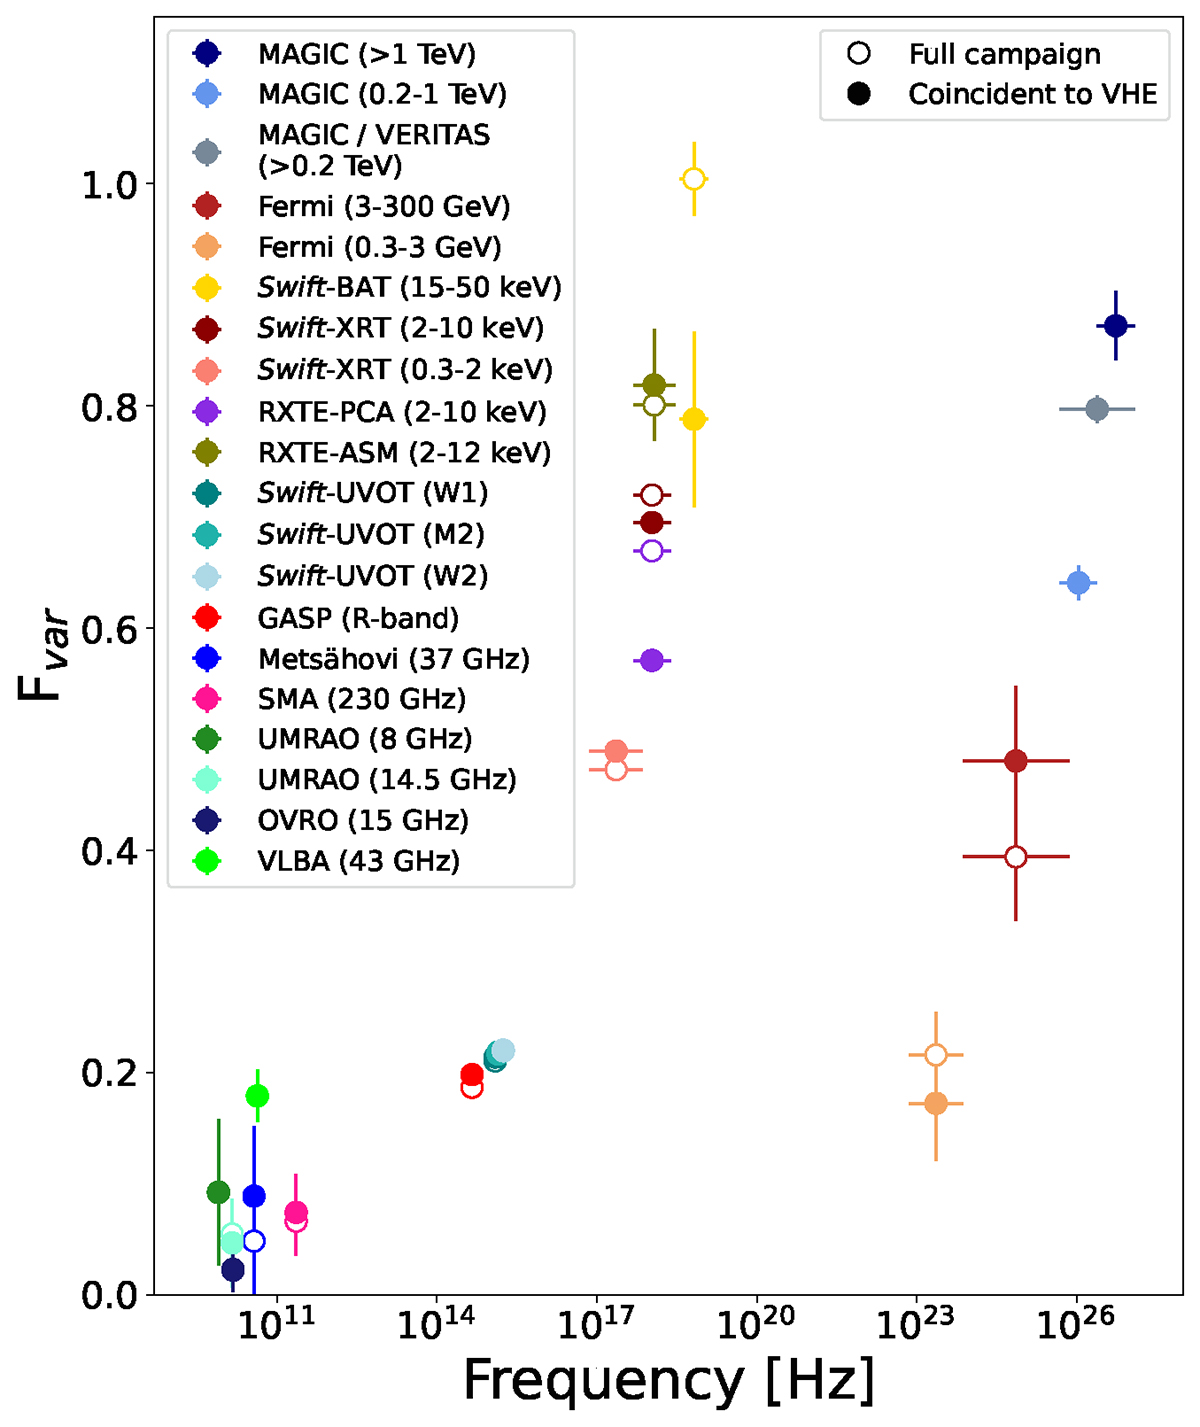
Fractional variability Fvar as a function of the frequency for the light curves shown in Fig. 1. Open markers show the results using the whole campaign for each light curve. Full markers only include quasi-simultaneous data to the VHE data (quasi-simultaneity is defined as temporal agreement with VHE data within 6 h for X-ray and UV data, within 1 day for optical data, and within 3 days for radio and Fermi-LAT data).
Current usage metrics show cumulative count of Article Views (full-text article views including HTML views, PDF and ePub downloads, according to the available data) and Abstracts Views on Vision4Press platform.
Data correspond to usage on the plateform after 2015. The current usage metrics is available 48-96 hours after online publication and is updated daily on week days.
Initial download of the metrics may take a while.