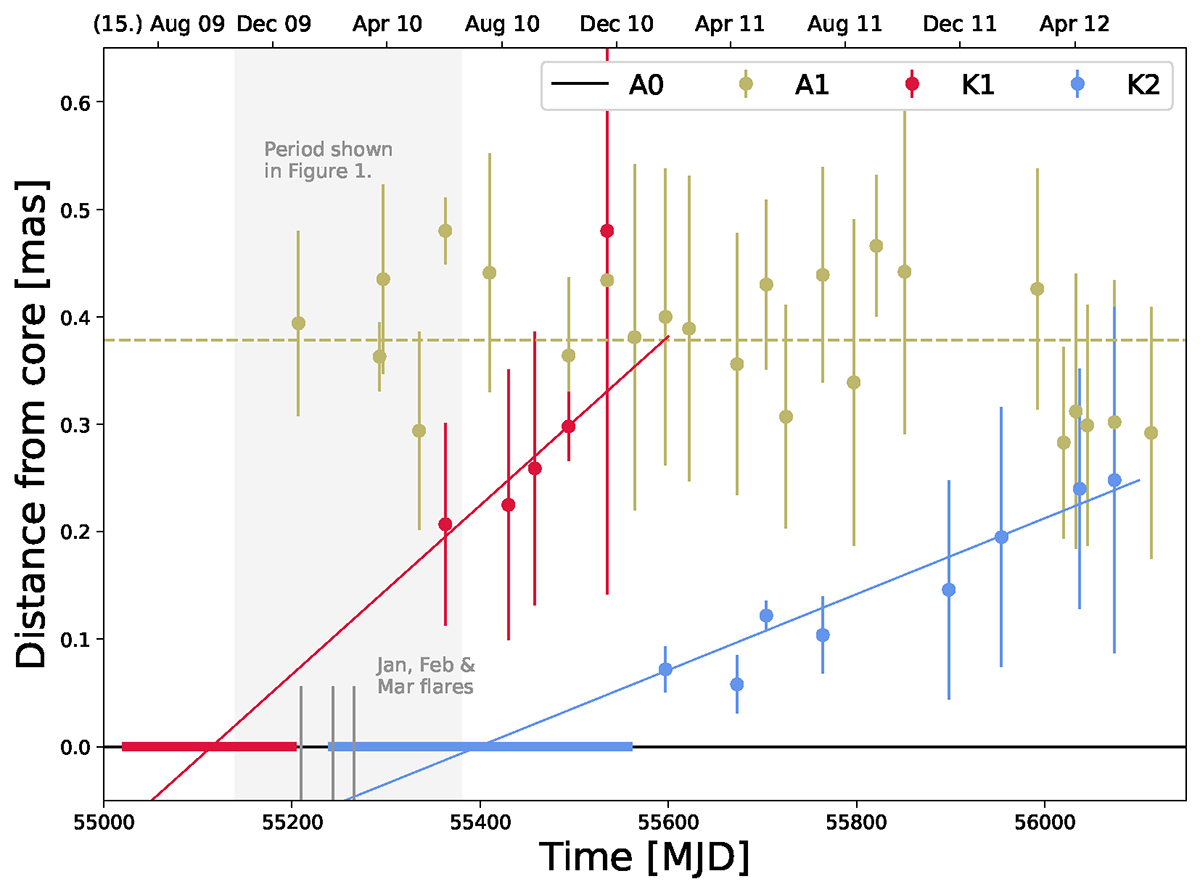
Fig. 3.
Download original image
Angular distance of A1 (yellow), K1 (red), and K2 (blue) from the jet core (black). At the location of Mrk 421, the angular distance of one mas is equivalent to a physical distance of 0.638 pc. The dotted yellow line indicates a constant fit of the quasi-stationary component. The red and blue lines show linear fits to determine the time of ejection of the components. The uncertainties on the ejection times are given by the red and blue bands. The campaign of this work is given by the light gray band with the three flares marked with gray lines.
Current usage metrics show cumulative count of Article Views (full-text article views including HTML views, PDF and ePub downloads, according to the available data) and Abstracts Views on Vision4Press platform.
Data correspond to usage on the plateform after 2015. The current usage metrics is available 48-96 hours after online publication and is updated daily on week days.
Initial download of the metrics may take a while.