Fig. F.2.
Download original image
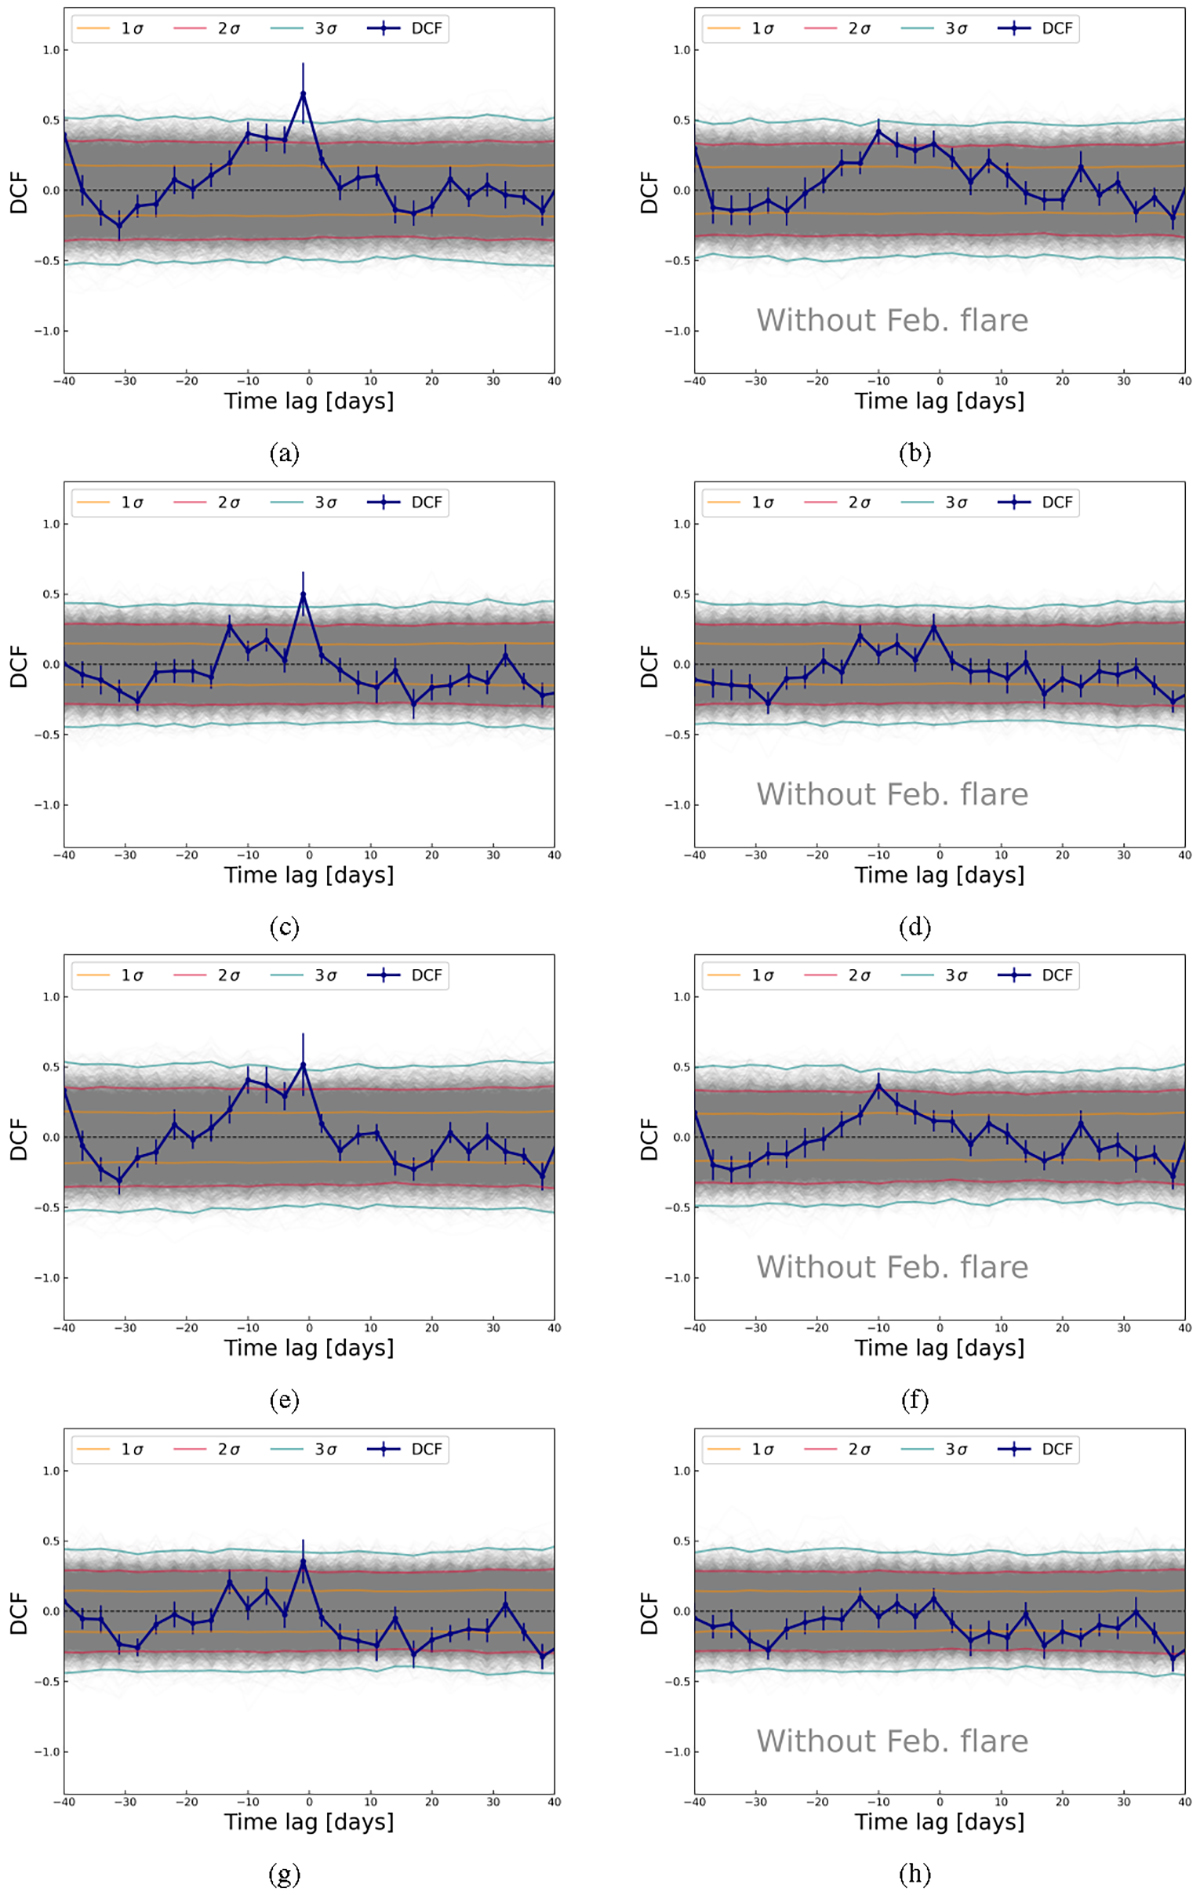
Discrete correlation function computed between two energy ranges provided by Fermi-LAT and Swift-XRT with and without the big flare in February using a binning of 3 days. It is computed for a range of time lags between -40 to +40 days. The 1 σ, 2 σ, and 3 σ confidence levels obtained by simulations are shown by the yellow, red, and green lines, respectively. (a) 3-300 GeV versus 0.3-2 keV; (b) 3-300 GeV versus 0.3-2 keV without the flare in February 2010; (c) 0.3-3 GeV versus 0.3-2 keV; (d) 0.3-3 GeV versus 0.3-2 keV without the flare in February 2010; (e) 3-300 GeV versus 2-10 keV; (f) 3-300 GeV versus 2-10 keV without the flare in February 2010; (g) 0.3-3 GeV versus 2-10 keV; (h) 0.3-3 GeV versus 2-10 keV without the flare in February 2010.
Current usage metrics show cumulative count of Article Views (full-text article views including HTML views, PDF and ePub downloads, according to the available data) and Abstracts Views on Vision4Press platform.
Data correspond to usage on the plateform after 2015. The current usage metrics is available 48-96 hours after online publication and is updated daily on week days.
Initial download of the metrics may take a while.