Fig. 1.
Download original image
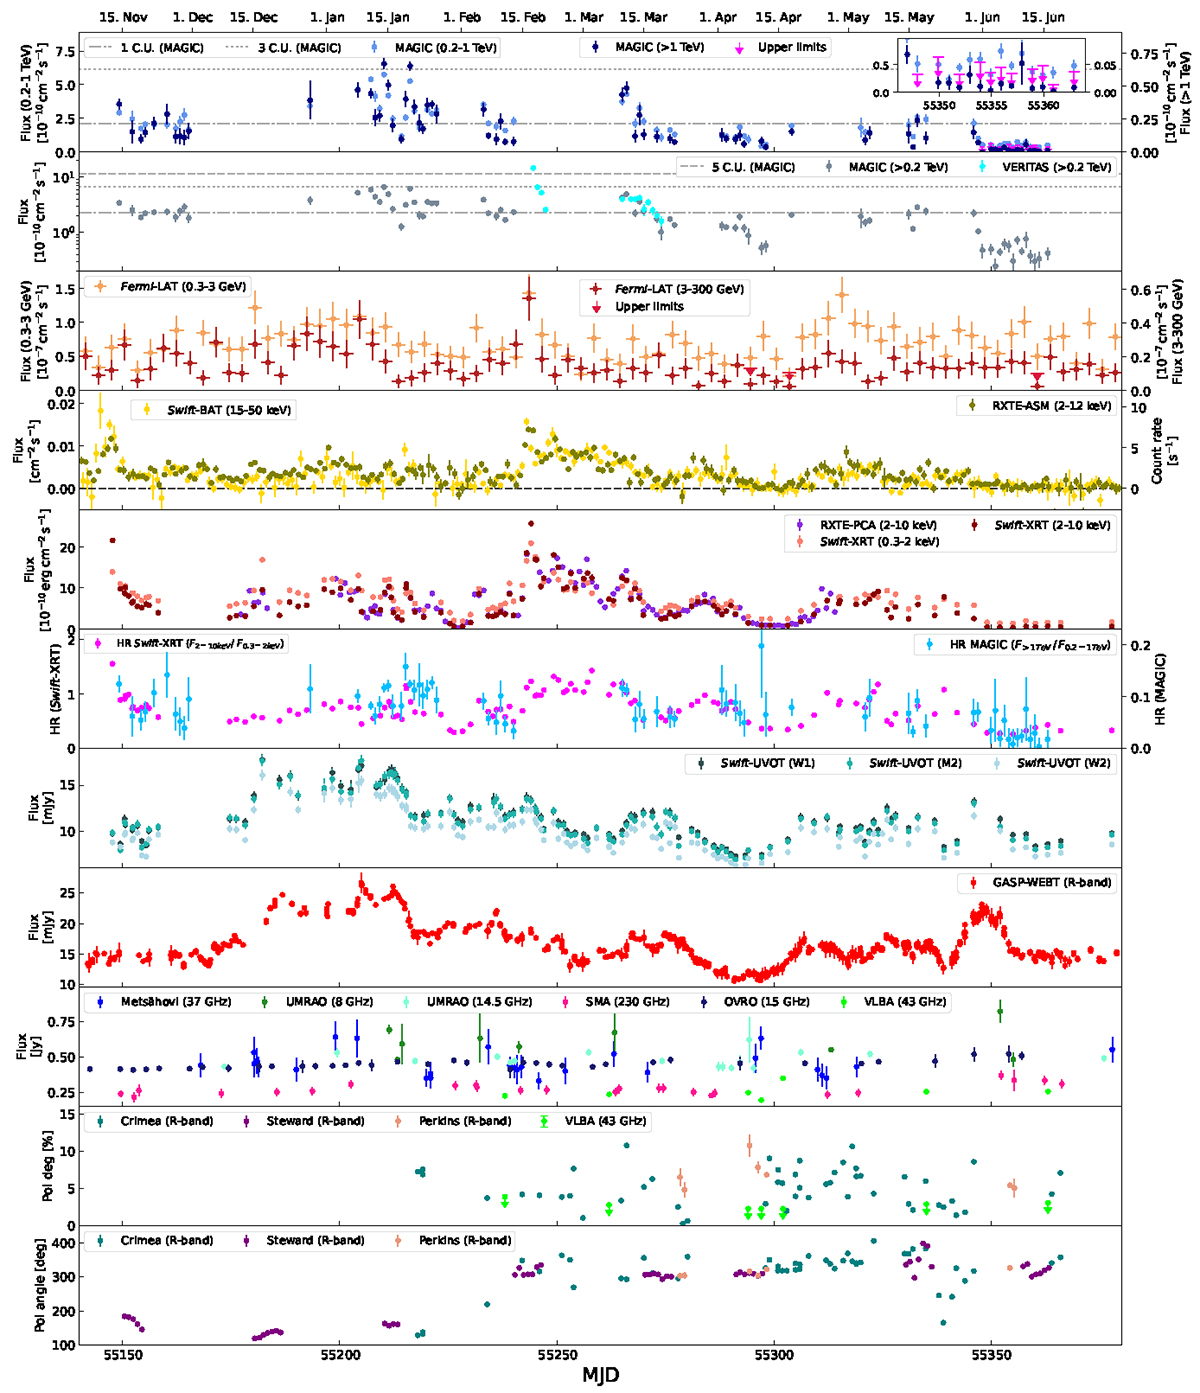
MWL light curves covering the time period from November 5, 2009, (MJD 55140) to July 3, 2010, (MJD 55380). Top to bottom: MAGIC fluxes in daily bins for two energy bands (note the two different y-axes); VHE fluxes obtained from MAGIC and VERITAS above 0.2 TeV (in log scale); Fermi-LAT fluxes in 3-day bins in two energy bands; X-ray fluxes in 1-day bins from the all-sky monitors Swift-BAT and RXTE-ASM; X-ray fluxes from the pointing instruments Swift-XRT and RXTE-PCA; hardness ratio between the high and low-energy fluxes of Swift-XRT and between the two VHE bands of MAGIC (note the two different y-axes); optical R-band data from GASP-WEBT; radio data from Metsähovi, UMRAO, SMA, OVRO and VLBA; polarization degree and polarization angle observations in the optical from the Steward and Perkins observatories and in radio from VLBA.
Current usage metrics show cumulative count of Article Views (full-text article views including HTML views, PDF and ePub downloads, according to the available data) and Abstracts Views on Vision4Press platform.
Data correspond to usage on the plateform after 2015. The current usage metrics is available 48-96 hours after online publication and is updated daily on week days.
Initial download of the metrics may take a while.