Fig. 8
Download original image
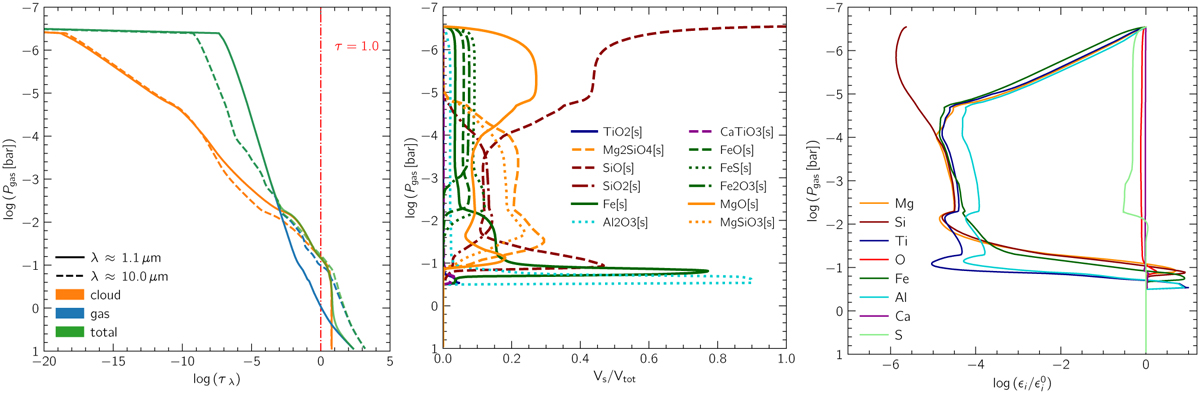
Cloud properties for a MSG model with SiO nucleation, at 1500 K, and log(ɡ) = 4.0. Left: optical depth of the cloud (orange), gas (blue), and total (green) throughout the atmosphere at λ ≈ 1.1 µm (solid curves) and λ ≈ 10.0 µm (dashed curves). The τ = 1.0 level is shown for reference (dash-dotted red line). Middle and right: composition of the cloud particles in units of volume fractions Vs /Vtot (middle) and the relative gas-phase element depletions ![]() (right).
(right).
Current usage metrics show cumulative count of Article Views (full-text article views including HTML views, PDF and ePub downloads, according to the available data) and Abstracts Views on Vision4Press platform.
Data correspond to usage on the plateform after 2015. The current usage metrics is available 48-96 hours after online publication and is updated daily on week days.
Initial download of the metrics may take a while.