Fig. 5
Download original image
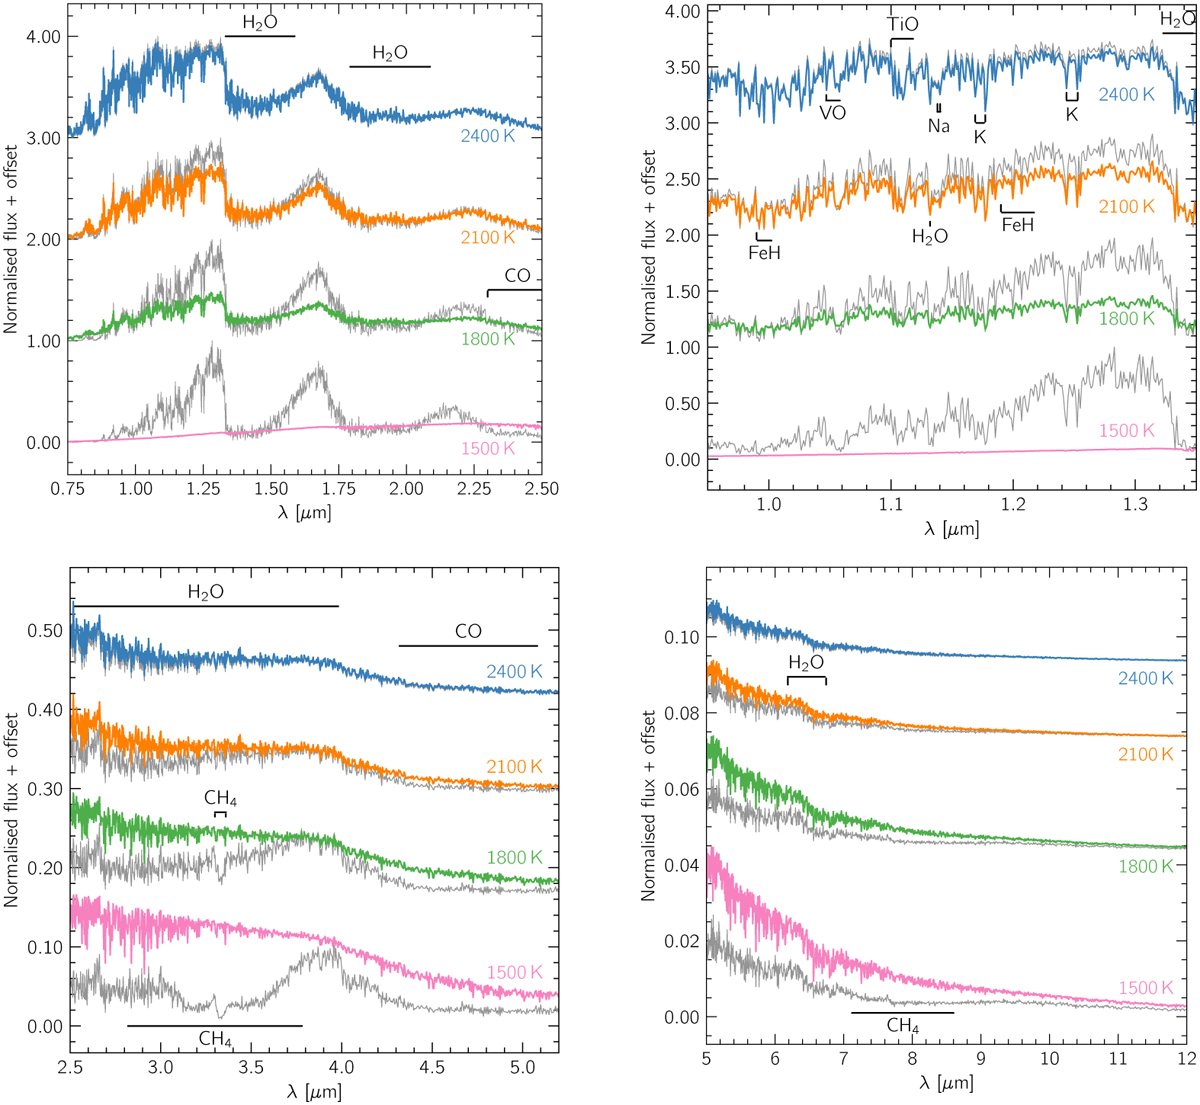
Synthetic spectra of MSG models with TiO2 nucleation at Teff = 2400 K (blue), 2100 K (orange), 1800 K (green), and 1500 K (pink), with log(ɡ) = 4.0, and the respective cloud-free spectra at the same Teff and log(ɡ) in grey. The emergent fluxes are normalised with respect to the cloud-free MSG spectra, i.e. ![]() , where Fnorm is the normalised flux, Fcloudy the flux from the cloudy model, and
, where Fnorm is the normalised flux, Fcloudy the flux from the cloudy model, and ![]() the maximum flux from the cloud-free model within the full wavelength range considered (~0.4 µm–20.0 µm). An arbitrary offset is added for clarity. In the top left plots we show the NIR range, in the top right the Y and J bands, in the bottom left the MIR, and the bottom right the thermal infrared. Important absorbers are respectively labelled.
the maximum flux from the cloud-free model within the full wavelength range considered (~0.4 µm–20.0 µm). An arbitrary offset is added for clarity. In the top left plots we show the NIR range, in the top right the Y and J bands, in the bottom left the MIR, and the bottom right the thermal infrared. Important absorbers are respectively labelled.
Current usage metrics show cumulative count of Article Views (full-text article views including HTML views, PDF and ePub downloads, according to the available data) and Abstracts Views on Vision4Press platform.
Data correspond to usage on the plateform after 2015. The current usage metrics is available 48-96 hours after online publication and is updated daily on week days.
Initial download of the metrics may take a while.