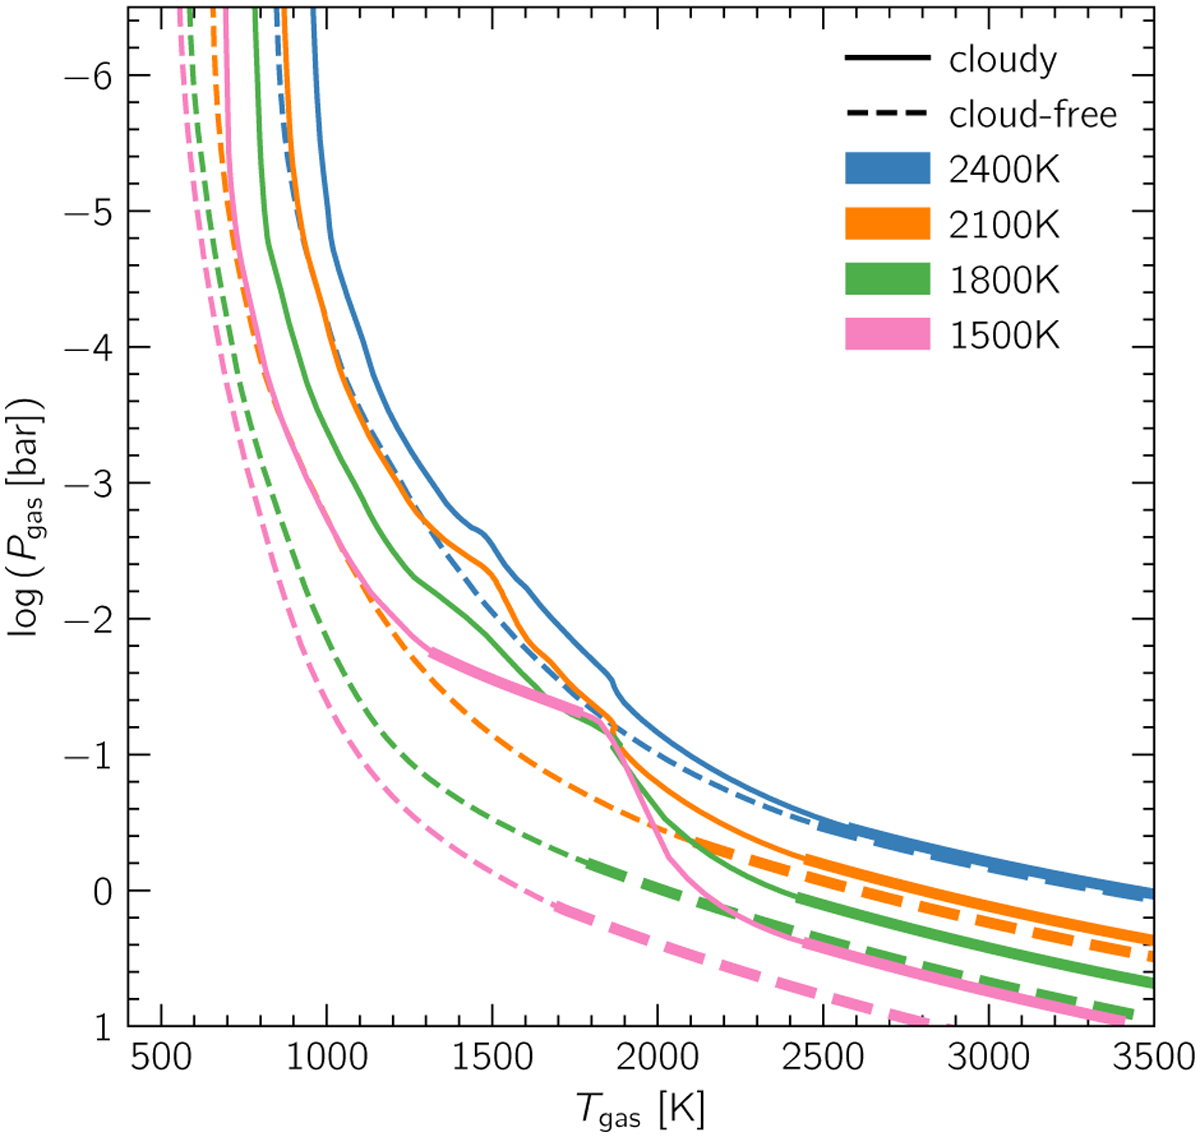
Fig. 2
Download original image
Pressure-temperature profiles for cloud-free MSG models (dashed curves) and cloudy MSG models with TiO2 nucleation (solid curves), at different effective temperatures and log(ɡ) = 4.0. Convective zones are plotted with thicker lines while radiative zones are plotted with thinner lines. We note that the cloudy profile at 1500 K has a detached convective zone.
Current usage metrics show cumulative count of Article Views (full-text article views including HTML views, PDF and ePub downloads, according to the available data) and Abstracts Views on Vision4Press platform.
Data correspond to usage on the plateform after 2015. The current usage metrics is available 48-96 hours after online publication and is updated daily on week days.
Initial download of the metrics may take a while.