Fig. F.3
Download original image
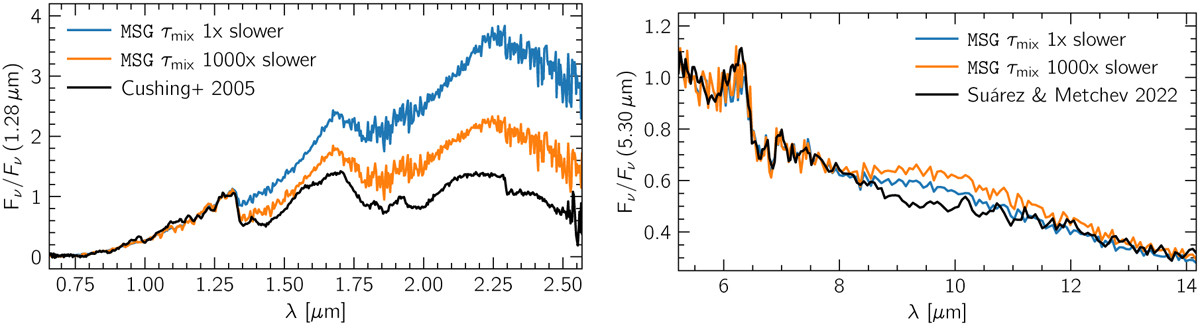
Comparison between observed spectra of 2MASS 1507-1627 (black curves) (Cushing et al. 2005; Suárez & Metchev 2022) and two MSG cloudy models with TiO2 nucleation: one with fully self-consistent mixing (blue curves), and the other where the mixing timescale was scaled up by 1000 times (orange curves). The MSG models are at Teff=1600 K and log(ɡ)=4.0.
Current usage metrics show cumulative count of Article Views (full-text article views including HTML views, PDF and ePub downloads, according to the available data) and Abstracts Views on Vision4Press platform.
Data correspond to usage on the plateform after 2015. The current usage metrics is available 48-96 hours after online publication and is updated daily on week days.
Initial download of the metrics may take a while.