Fig. F.1
Download original image
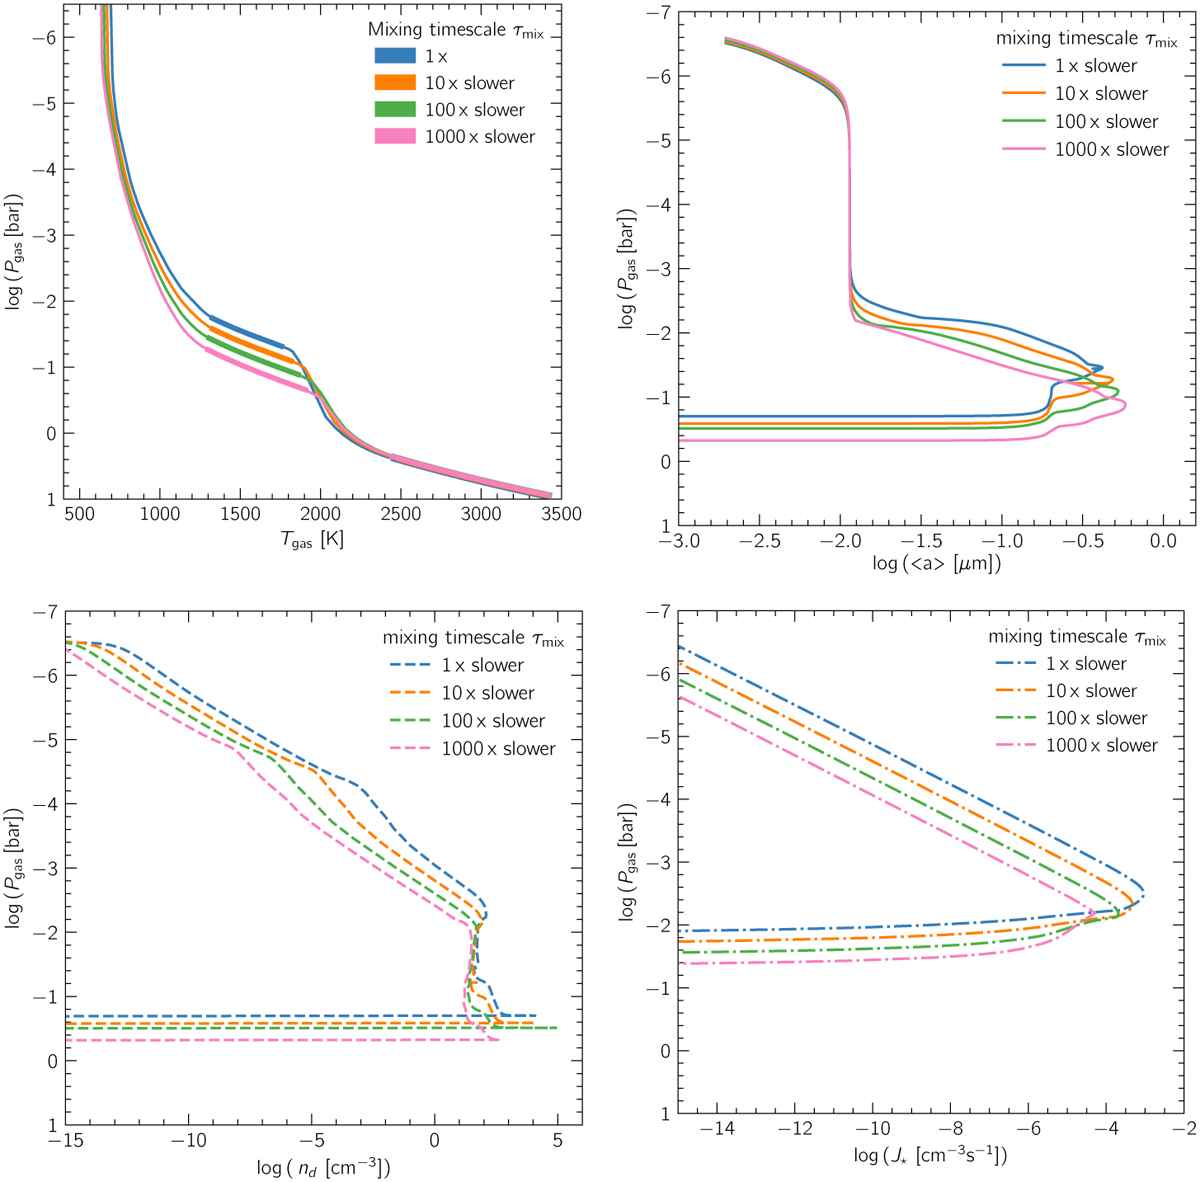
Pressure-temperature profiles (top left) for MSG models with TiO2 nucleation, at Teff = 1500 K and log(ɡ) = 4.0, and different mixing timescale scalings (1x, 10x slower, 100x slower, 1000x slower). Convective zones are plotted with thicker lines while radiative zones are plotted with thinner lines. The average cloud particle size ⟨a⟩ (top right), the cloud particle number density nd (bottom left) and the nucleation rate J⋆ (bottom right) in the atmosphere for models with TiO2 nucleation at Teff = 1500 K and log(ɡ) = 4.0, and different mixing timescale scalings.
Current usage metrics show cumulative count of Article Views (full-text article views including HTML views, PDF and ePub downloads, according to the available data) and Abstracts Views on Vision4Press platform.
Data correspond to usage on the plateform after 2015. The current usage metrics is available 48-96 hours after online publication and is updated daily on week days.
Initial download of the metrics may take a while.