Open Access
Fig. 12
Download original image
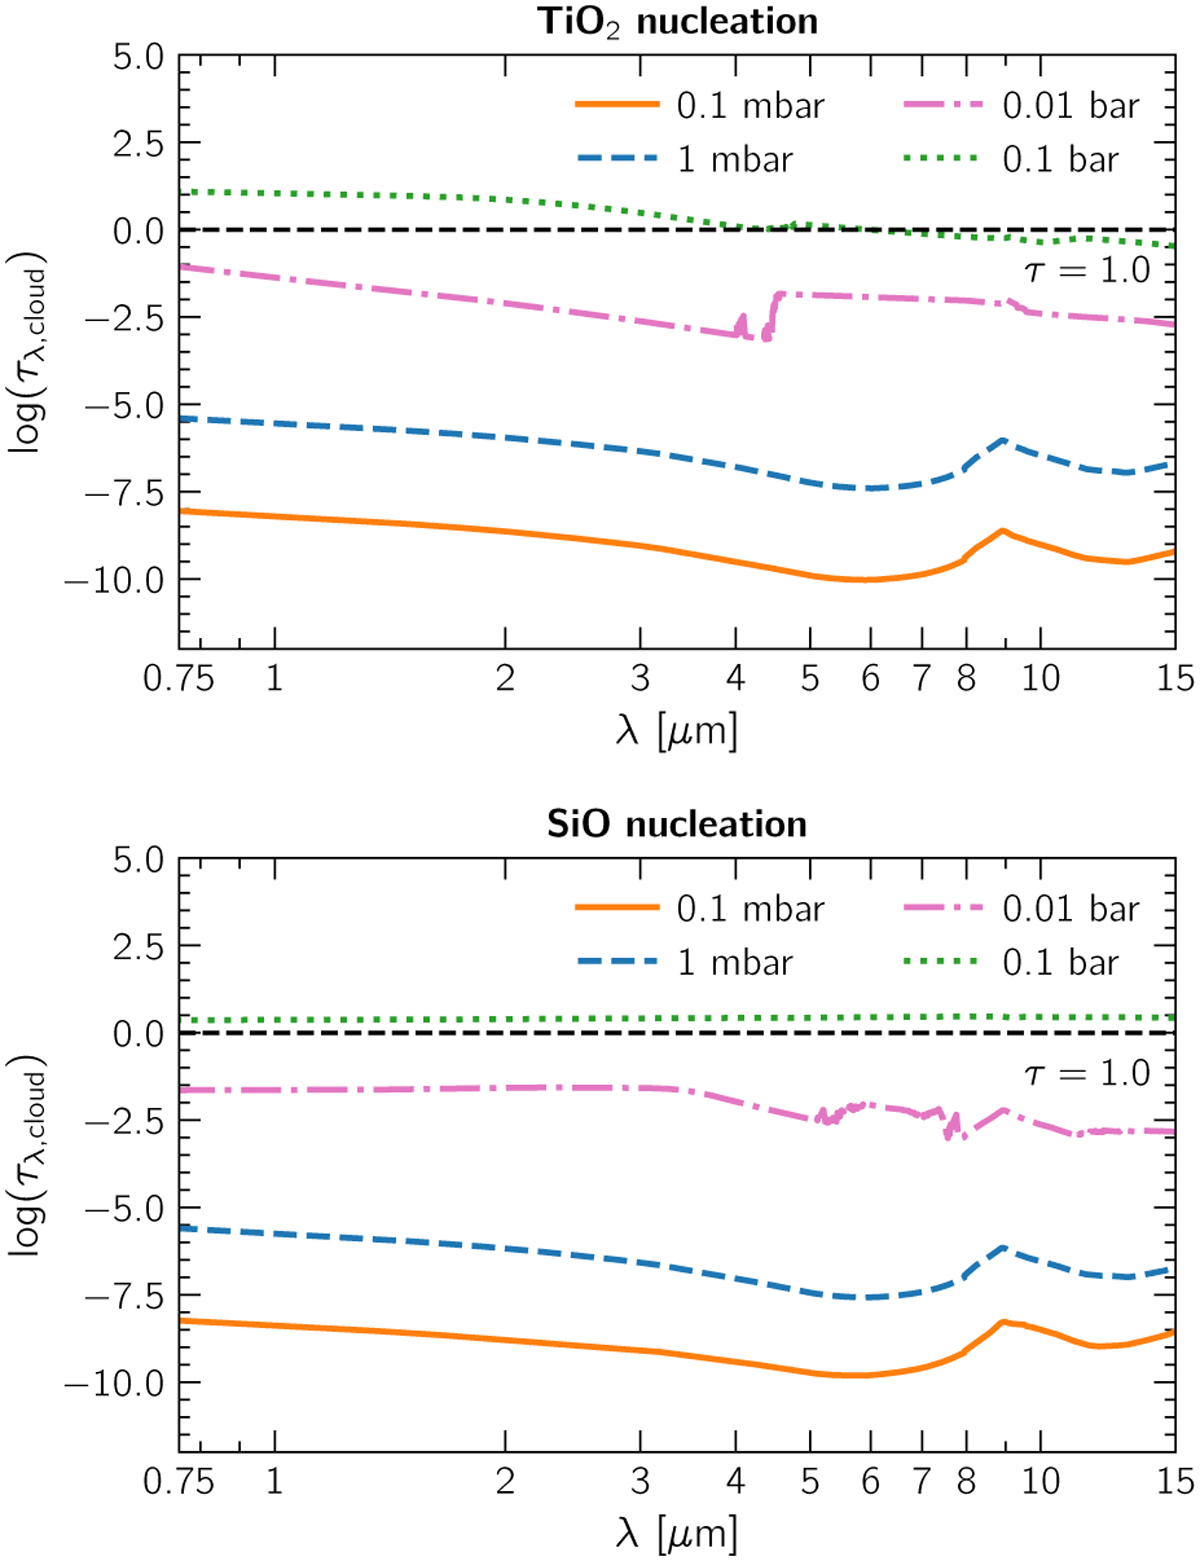
Cloud optical depth as a function of wavelength, at four different heights (pressures) in the atmosphere, for two MSG models at Teff= 1500 K, log(ɡ) = 4.0, with TiO2 nucleation (top) and SiO nucleation (bottom). The τ = 1.0 level is plotted as the dashed black curve for reference.
Current usage metrics show cumulative count of Article Views (full-text article views including HTML views, PDF and ePub downloads, according to the available data) and Abstracts Views on Vision4Press platform.
Data correspond to usage on the plateform after 2015. The current usage metrics is available 48-96 hours after online publication and is updated daily on week days.
Initial download of the metrics may take a while.