Fig. 1
Download original image
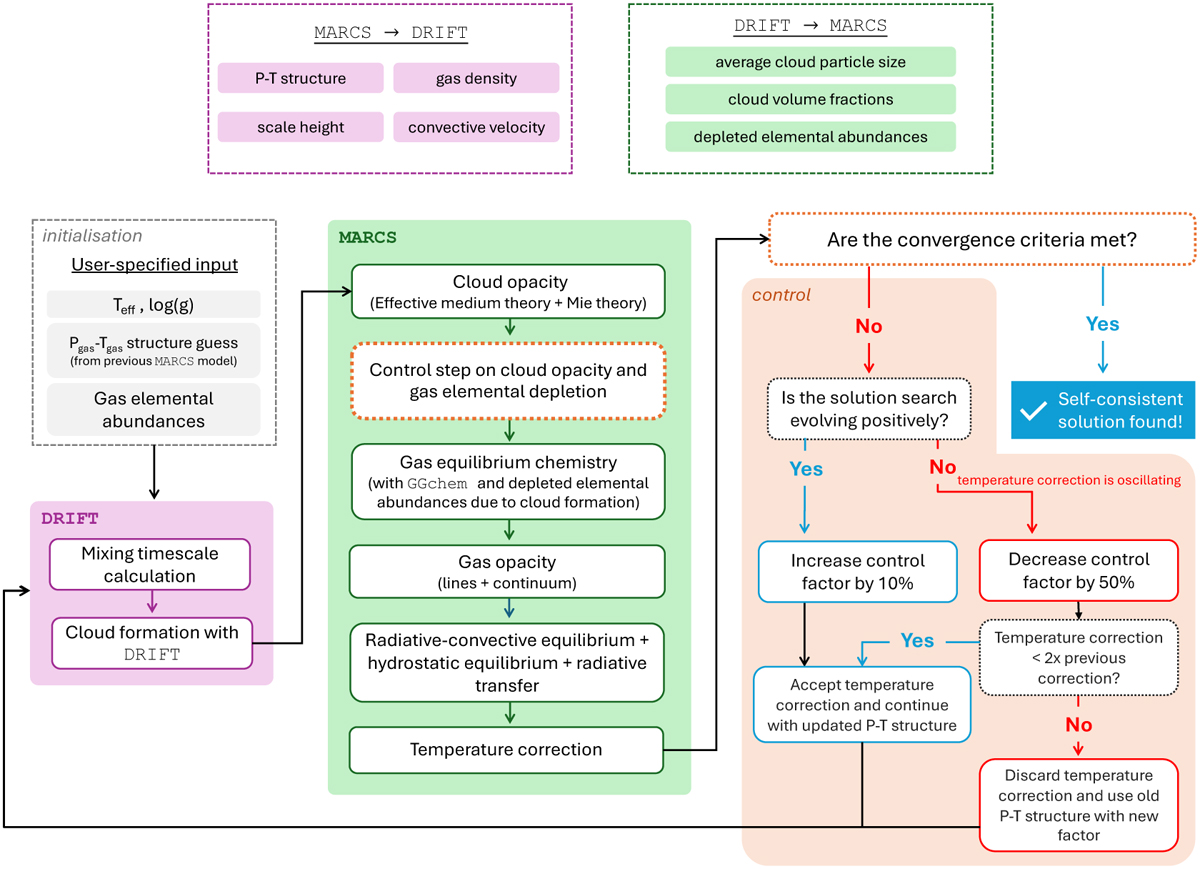
Diagram of the MSG model algorithm for cloudy sub-stellar atmospheres. The boxes with a dashed outline indicate parameters that are inputs to the model. The boxes with a dotted outline indicate control processes within the workflow. A detailed explanation of the cloud formation process can be seen in Sect. 2. The control process is explained in detail in Sect. 4.3. The convergence criteria considered under the control process are described in Sect. 4.1.
Current usage metrics show cumulative count of Article Views (full-text article views including HTML views, PDF and ePub downloads, according to the available data) and Abstracts Views on Vision4Press platform.
Data correspond to usage on the plateform after 2015. The current usage metrics is available 48-96 hours after online publication and is updated daily on week days.
Initial download of the metrics may take a while.