Fig. A.1.
Download original image
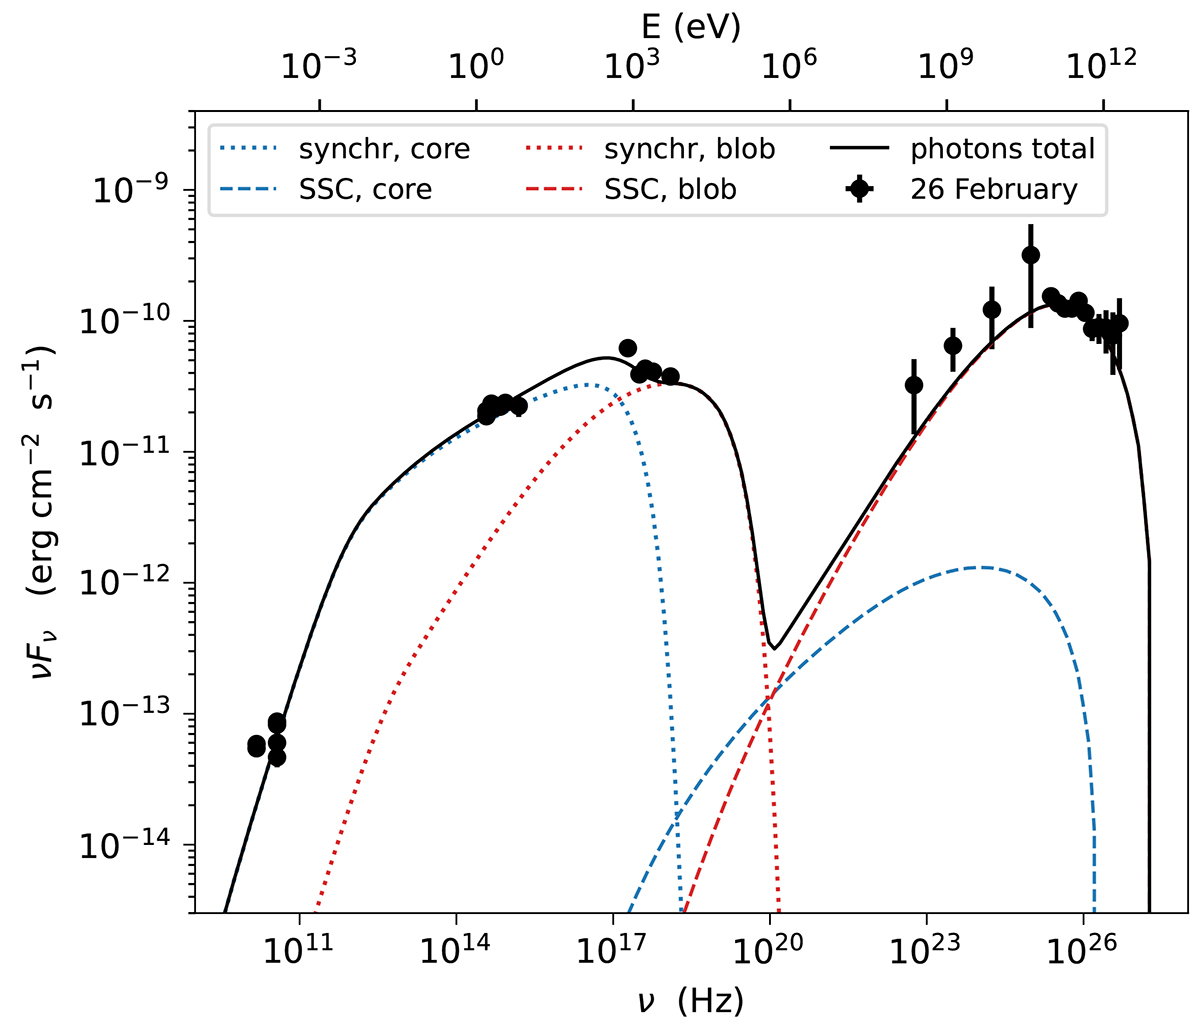
Contributions from different radiative processes to the SED of VER J0521+211 (state A) in a leptonic scenario, where two non-interacting regions (blob and core) are responsible for the total emission detected. For the core, the synchrotron and SSC emission are represented by dotted and dashed blue lines, while for the blob, these radiation fields are shown in dotted and dashed red curves, respectively. The total emission is shown as a black curve.
Current usage metrics show cumulative count of Article Views (full-text article views including HTML views, PDF and ePub downloads, according to the available data) and Abstracts Views on Vision4Press platform.
Data correspond to usage on the plateform after 2015. The current usage metrics is available 48-96 hours after online publication and is updated daily on week days.
Initial download of the metrics may take a while.