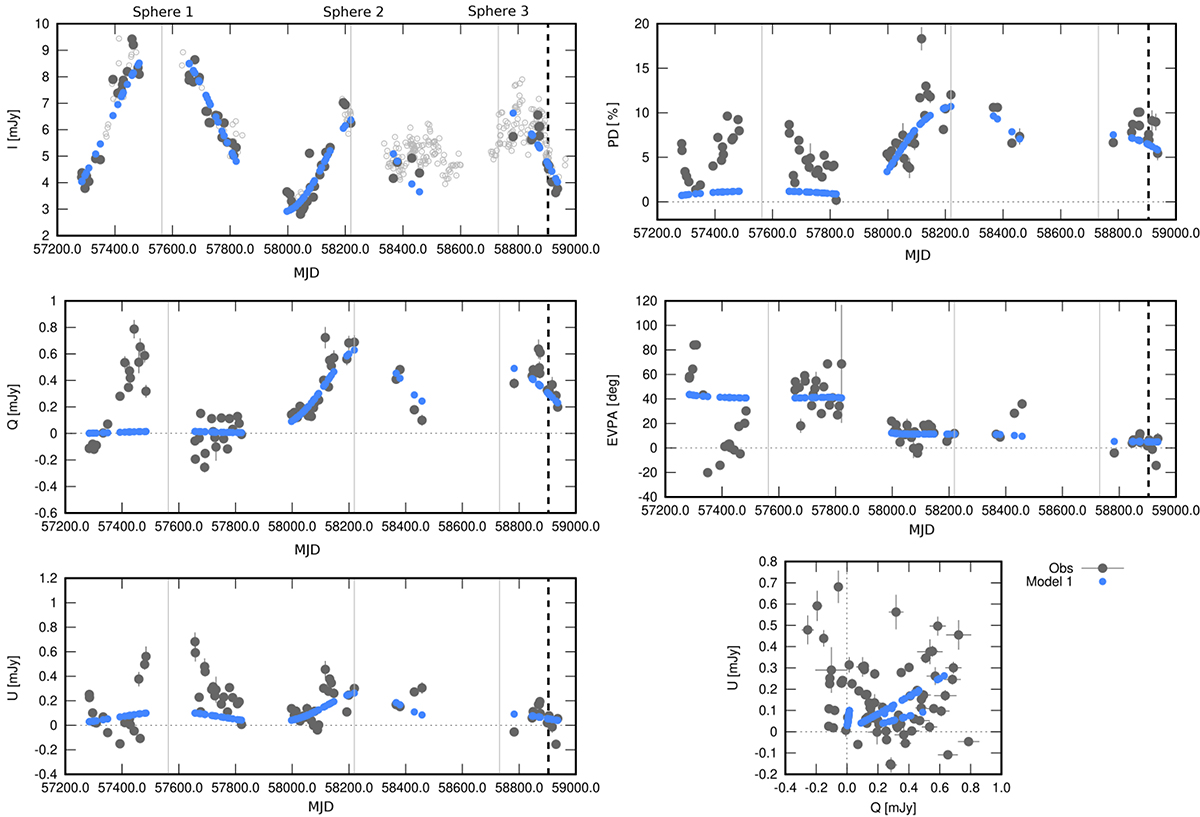
Fig. 6.
Download original image
Modelling results (blue circles) of the optical (R-band) polarisation data (grey circles). The small open circles denote optical intensity data that has no simultaneous polarisation observations. Such data are excluded from the modelling. Panels from top to bottom on the left: optical intensity, Q and U Stokes parameters. Panels from top to bottom on the right: PD, EVPA, Q-U plane. Vertical grey lines indicate epochs corresponding to the entrance time of the spherical density enhancements (spheres) into the emission zone. Dashed vertical lines indicate the time of the 2020 HE flare.
Current usage metrics show cumulative count of Article Views (full-text article views including HTML views, PDF and ePub downloads, according to the available data) and Abstracts Views on Vision4Press platform.
Data correspond to usage on the plateform after 2015. The current usage metrics is available 48-96 hours after online publication and is updated daily on week days.
Initial download of the metrics may take a while.