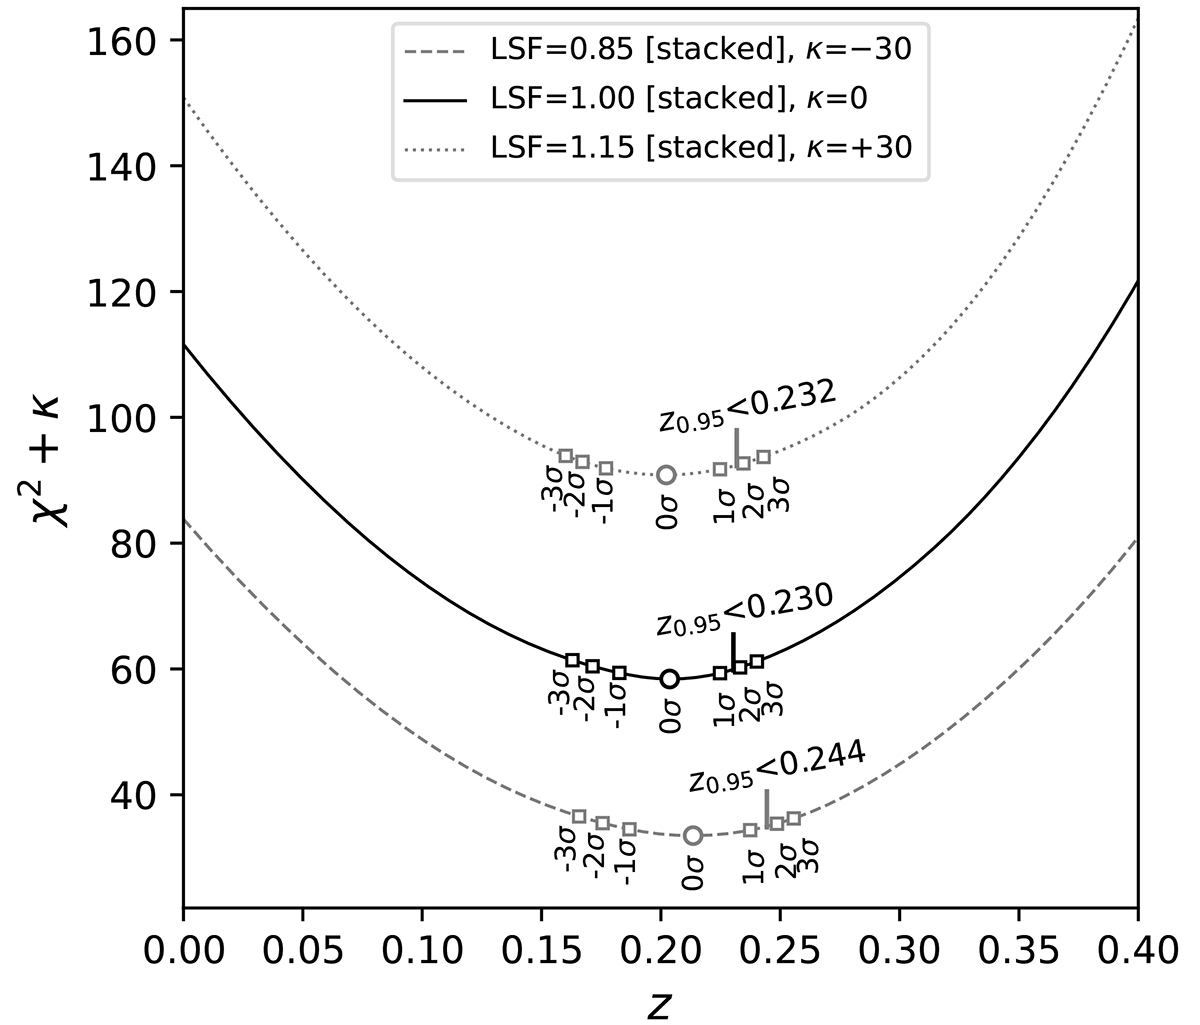
Fig. 4.
Download original image
Statistical redshift reconstruction using a profile-χ2 scan for different LSFs, jointly for the four states considered in this work. The solid, dotted, and dashed curves represent the profile-χ2 for a given LSF (nominal, and ±15%, respectively). The best-fit value is shown for each case as an open circle, the ±1σ, ±2σ, and ±3σ two-sided confidence bands represented as small open squares. Finally, the 95% confidence level upper limit is represented as a vertical bar and its actual value shown in the plot. An artificial constant κ was added to two of the curves for clarity purposes.
Current usage metrics show cumulative count of Article Views (full-text article views including HTML views, PDF and ePub downloads, according to the available data) and Abstracts Views on Vision4Press platform.
Data correspond to usage on the plateform after 2015. The current usage metrics is available 48-96 hours after online publication and is updated daily on week days.
Initial download of the metrics may take a while.