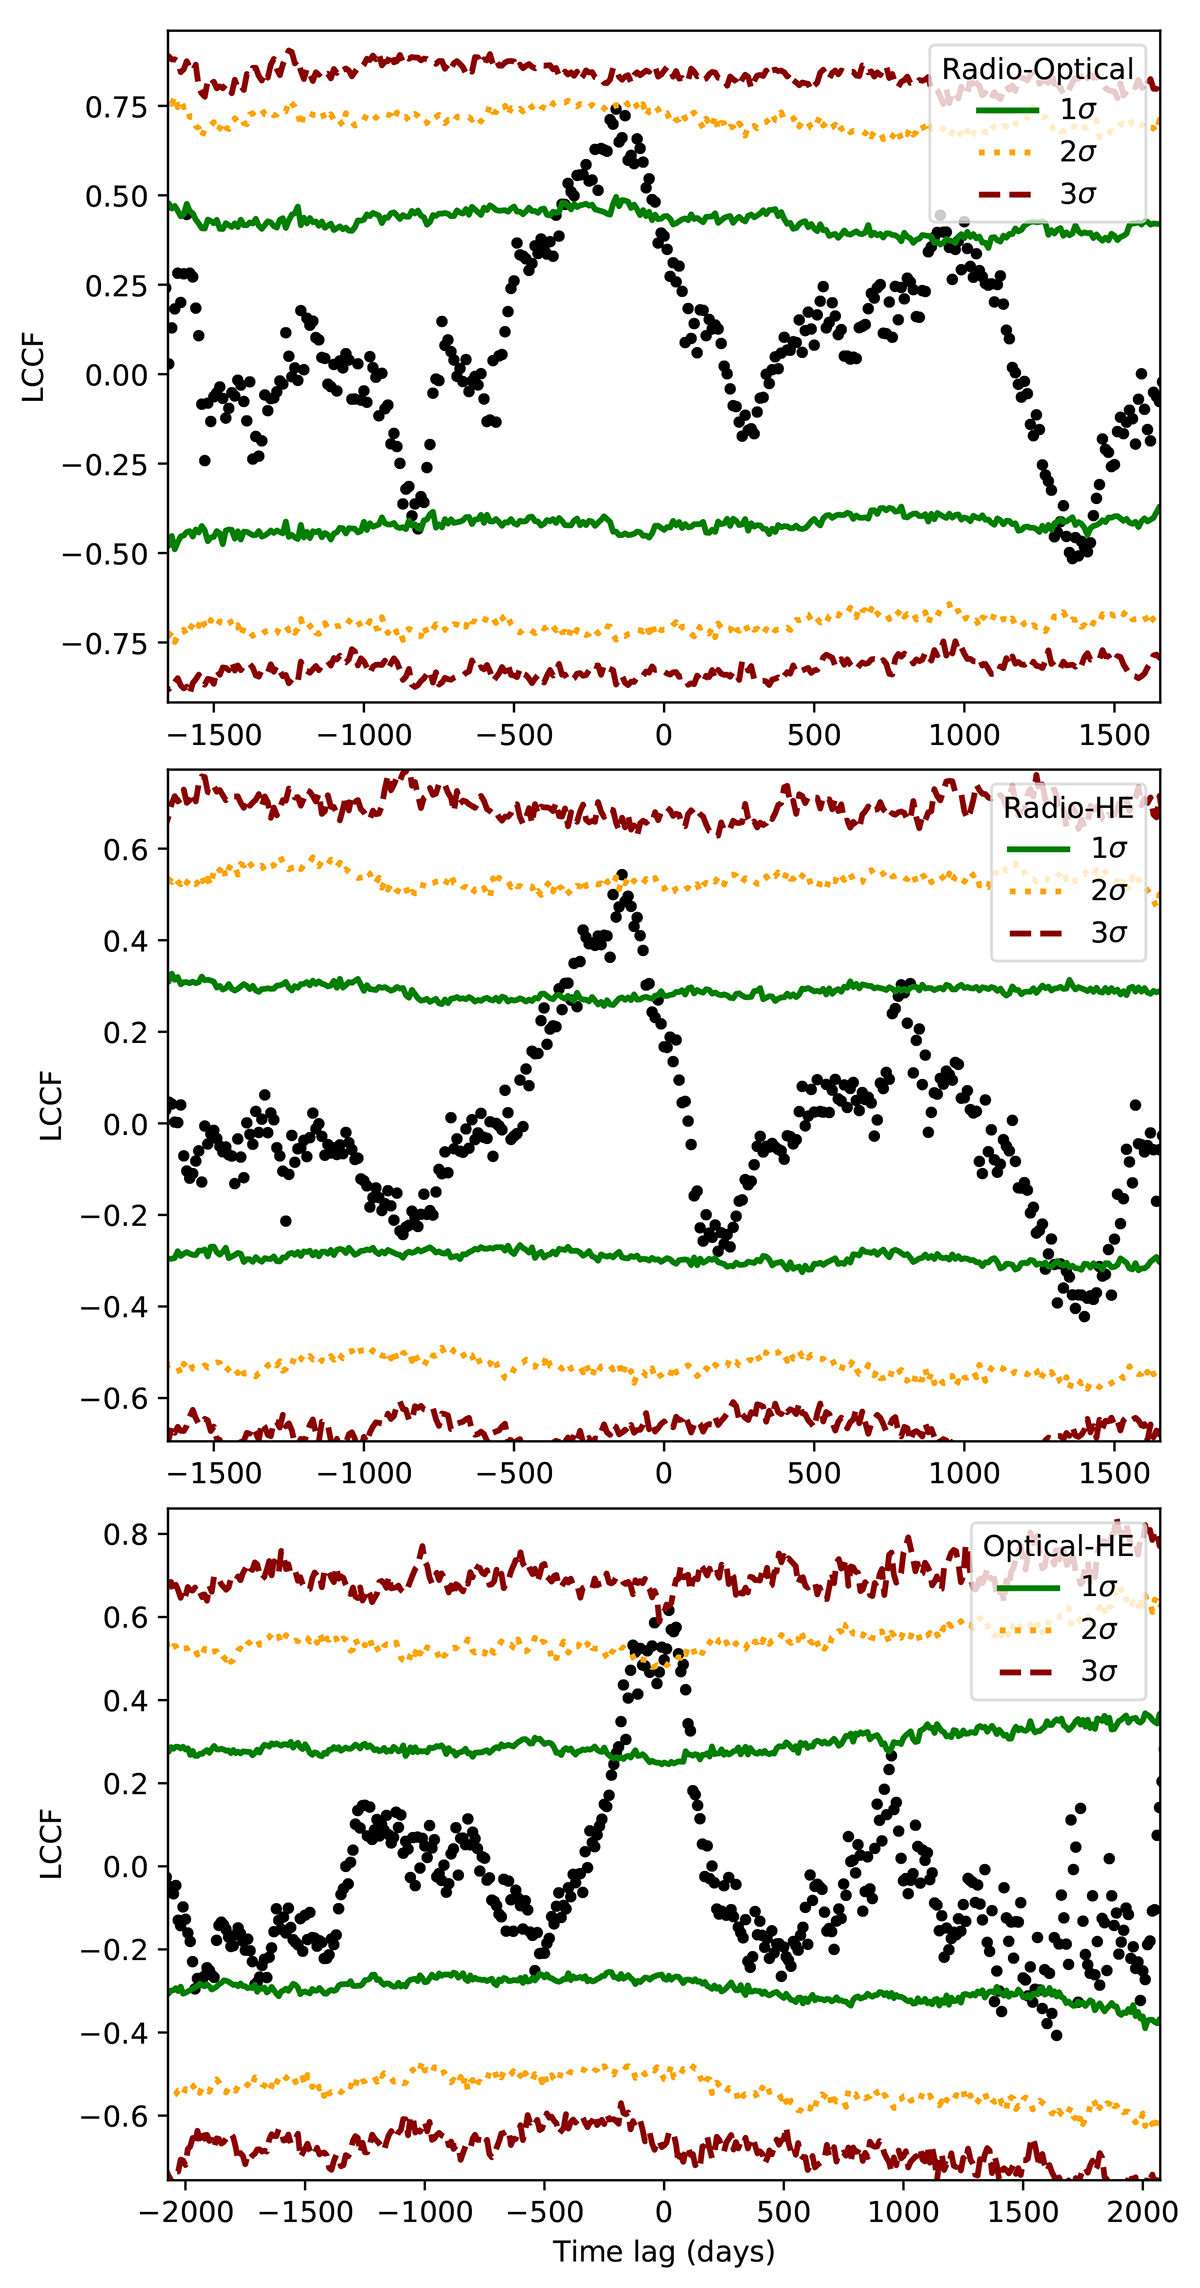
Fig. 3.

Download original image
DCF/LCCF correlation test results of the long-term radio and optical data, radio and HE gamma-ray data, and optical and HE gamma-ray data. The time lags found for each data set pair were −160 ± 11, −140 ± 13 and 20 ± 12 days. A negative time lag implies that the higher-energy band is leading the lower-energy band and a positive one the opposite. The solid green, dotted orange, and dashed red lines show the 1σ, 2σ, and 3σ significance levels, respectively.
Current usage metrics show cumulative count of Article Views (full-text article views including HTML views, PDF and ePub downloads, according to the available data) and Abstracts Views on Vision4Press platform.
Data correspond to usage on the plateform after 2015. The current usage metrics is available 48-96 hours after online publication and is updated daily on week days.
Initial download of the metrics may take a while.


