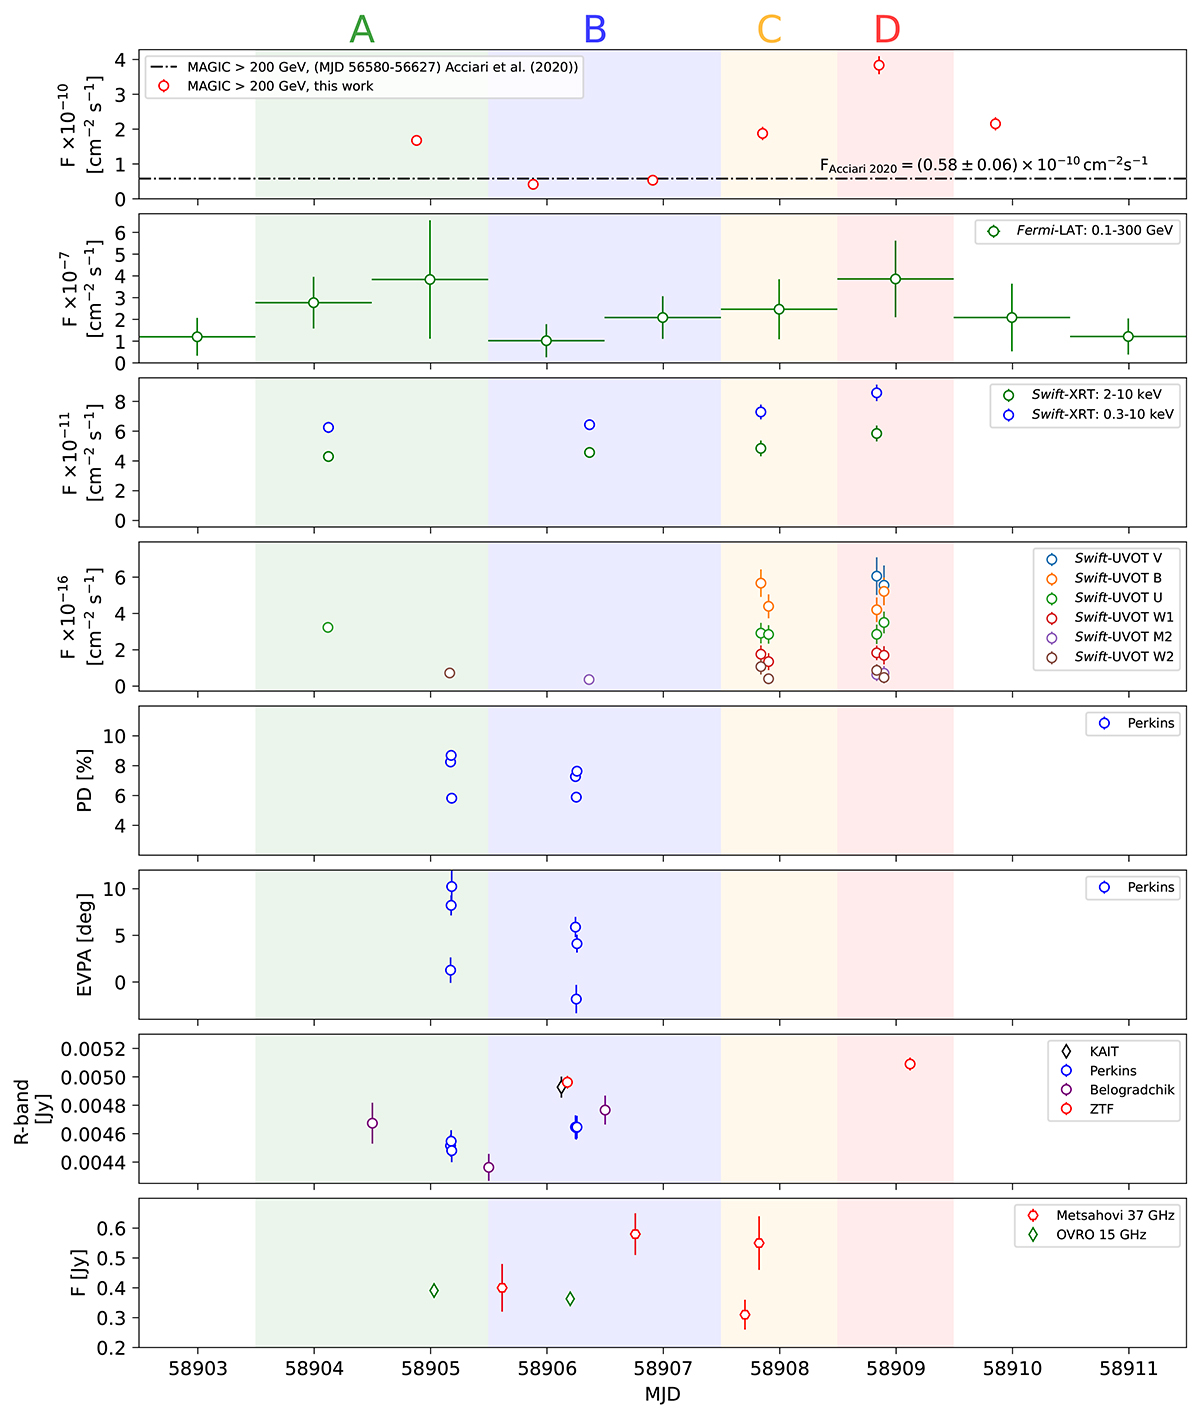
Fig. 2.
Download original image
Multi-wavelength light curve showing the evolution of the flux of VER J0521+211 in different bands and its optical polarisation during the 2020 flare. From top to bottom: VHE gamma rays (with a reference value from MAGIC Collaboration 2020), HE gamma-ray flux, X-ray flux, UV and optical in various bands, R-band flux from various optical telescopes as well as the evolution of PD and EVPA, and radio flux. Shaded background colours define the states A-D used to build the SED of the source, as is described in Table 1.
Current usage metrics show cumulative count of Article Views (full-text article views including HTML views, PDF and ePub downloads, according to the available data) and Abstracts Views on Vision4Press platform.
Data correspond to usage on the plateform after 2015. The current usage metrics is available 48-96 hours after online publication and is updated daily on week days.
Initial download of the metrics may take a while.