Open Access
Fig. 1.
Download original image
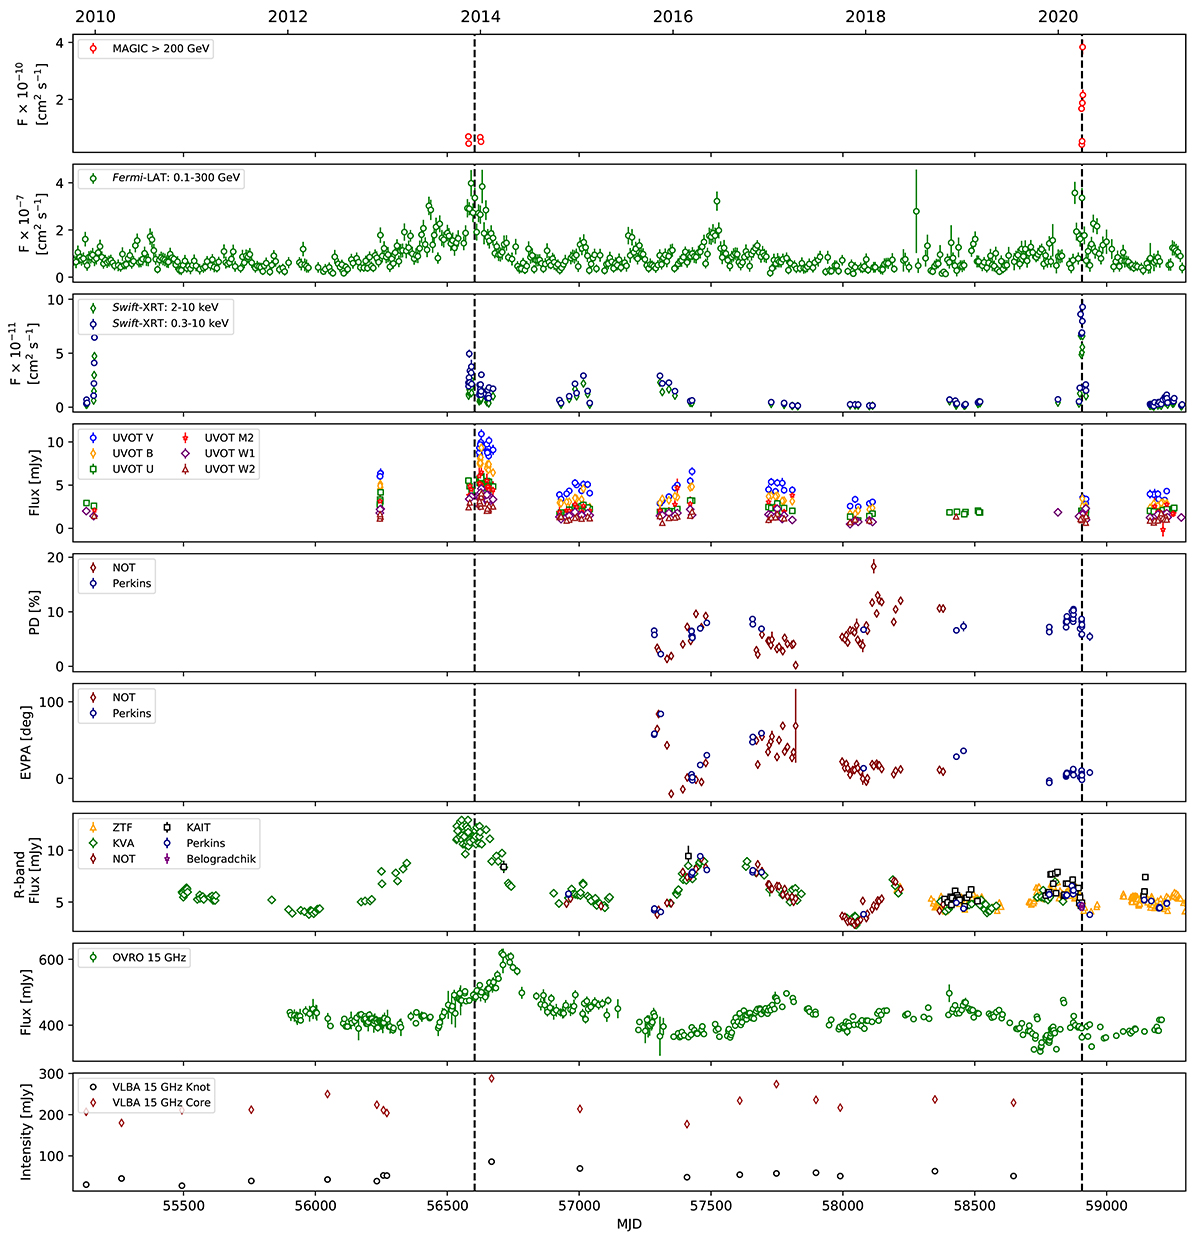
Long-term MWL light curve of VER 0521+211 displaying the behaviour of the source from VHE gamma rays (top) to radio core intensity at 15 GHz (bottom). The dashed vertical lines indicate the two flaring episodes, the 2013 flare as archival data from MAGIC Collaboration 2020 and the 2020 flare, in the VHE gamma-ray band.
Current usage metrics show cumulative count of Article Views (full-text article views including HTML views, PDF and ePub downloads, according to the available data) and Abstracts Views on Vision4Press platform.
Data correspond to usage on the plateform after 2015. The current usage metrics is available 48-96 hours after online publication and is updated daily on week days.
Initial download of the metrics may take a while.