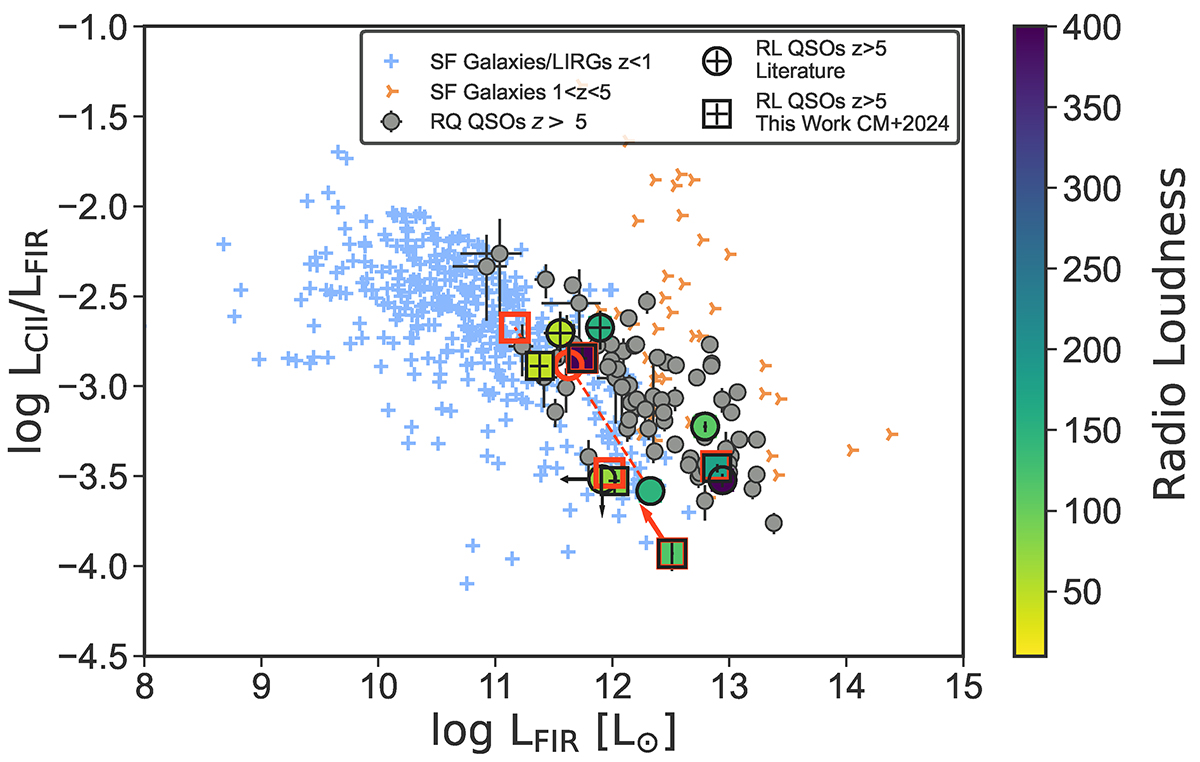
Fig. 8.
Download original image
[C II]-to-FIR luminosity ratio as a function of FIR luminosity. Observations of star-forming galaxies and LIRGs at z < 1 are shown with light blue crosses. We report the star-forming galaxies at 1 < z < 5 with orange arrows. RQ quasars from the literature are depicted with grey points. All references for these data are reported in Sects. 4.1 and 4.4. The circles indicate the RL quasars observations from Khusanova et al. (2022), Venemans et al. (2020), and Banados et al. (2024b). The squares indicate the values derived in this work, assuming that the total measured ALMA continuum flux is due only to dust, all color-coded for radio loudness parameter. We note that RL quasars occupy a similar parameter space of that of RQ quasar hosts, with the exception of the sources J0131-0321 and J0410-0139 (with L[C II]/LFIR ∼ 10−3.5 − 4). When considering FIR luminosities accounting for the synchrotron contribution-derived flux (red squares for sources from this work, red circle from Banados et al. 2024b), even the above mentioned outliers move closer to the locations of the RQ quasar hosts.
Current usage metrics show cumulative count of Article Views (full-text article views including HTML views, PDF and ePub downloads, according to the available data) and Abstracts Views on Vision4Press platform.
Data correspond to usage on the plateform after 2015. The current usage metrics is available 48-96 hours after online publication and is updated daily on week days.
Initial download of the metrics may take a while.