Fig. 6.
Download original image
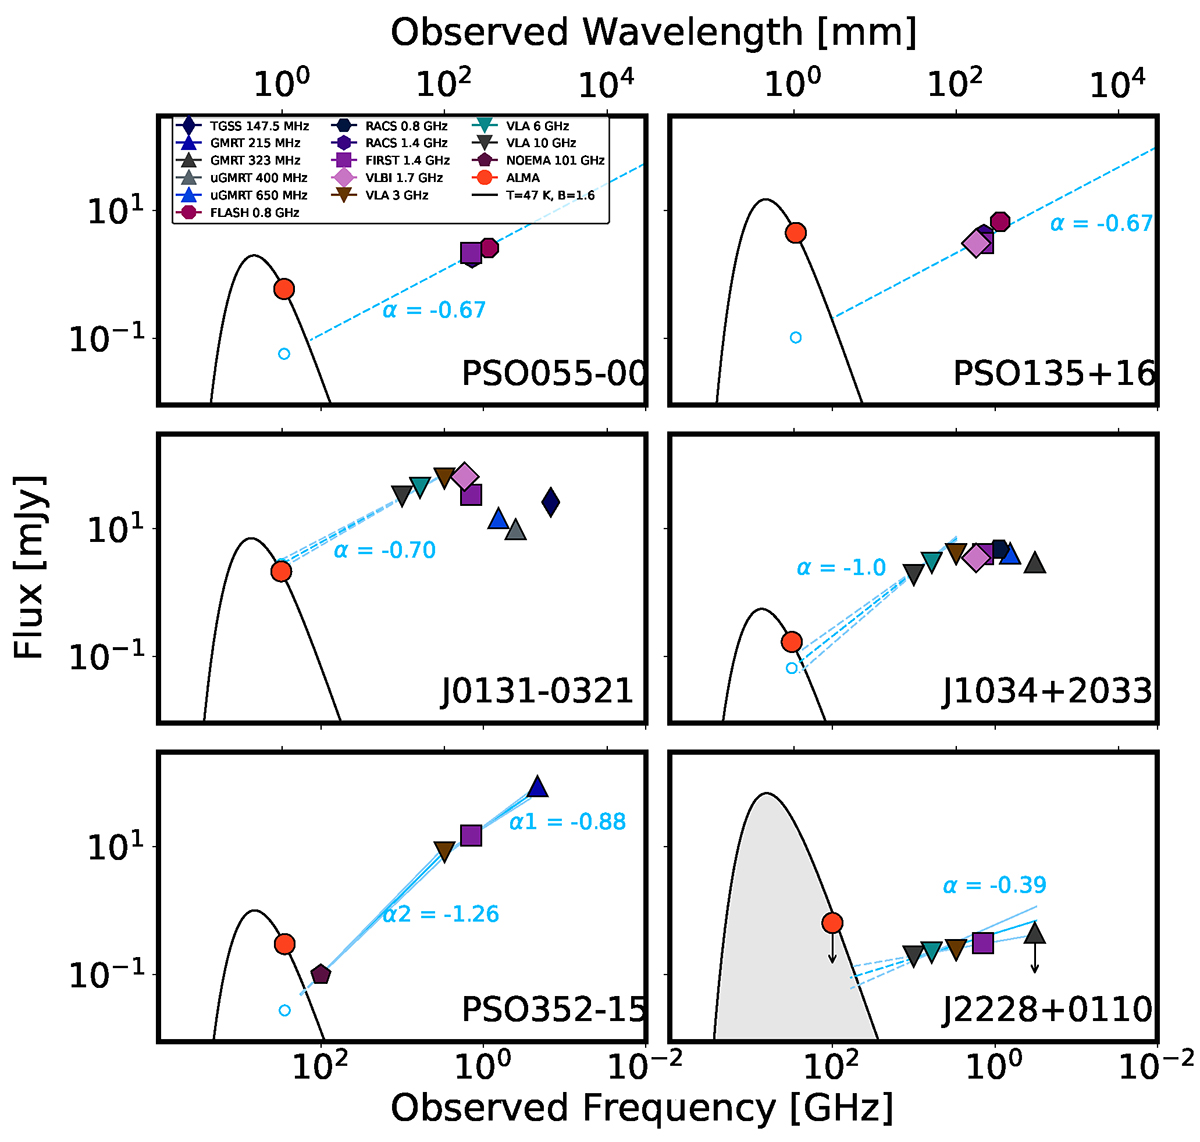
Radio and (sub)mm spectral energy distributions (SED) of RL quasars reported in this work. We show the continuum emission at 1 mm from our ALMA Band 7 observations (orange circles) and the relative best fit of the modified black body dust emission (black line). In the case of J2228+0110, we could retrieve only upper-limits from our ALMA Band 3 data and we show the corresponding limits on its dust emission with a shaded grey area. All modified black-body are calculated with T = 47 K and β = 1.6 (see Sect. 4.4). For each quasar, we report the radio observations obtained from a collection of literature data (see Sect. 4.3 for references). For J0131-0321, J1034+2033, PSO352-15, J2228+0110 we show (broken) power-law radio emissions, with slopes (α) derived from fits in the literature. For PSO055-00, PSO135+16, we assume a median high−z slope value (see Sect. 4.3). The solid light blue lines are the measured power-law functions, while we report with dashed lines the extrapolation to lower and higher frequencies. The light cyan lines highlight the regions encompassed by the 1σ uncertainties on the power-law slopes. We show with light blue empty circles the flux extrapolated from the synchtrotron power-law functions at the ALMA frequency targeted in this work.
Current usage metrics show cumulative count of Article Views (full-text article views including HTML views, PDF and ePub downloads, according to the available data) and Abstracts Views on Vision4Press platform.
Data correspond to usage on the plateform after 2015. The current usage metrics is available 48-96 hours after online publication and is updated daily on week days.
Initial download of the metrics may take a while.