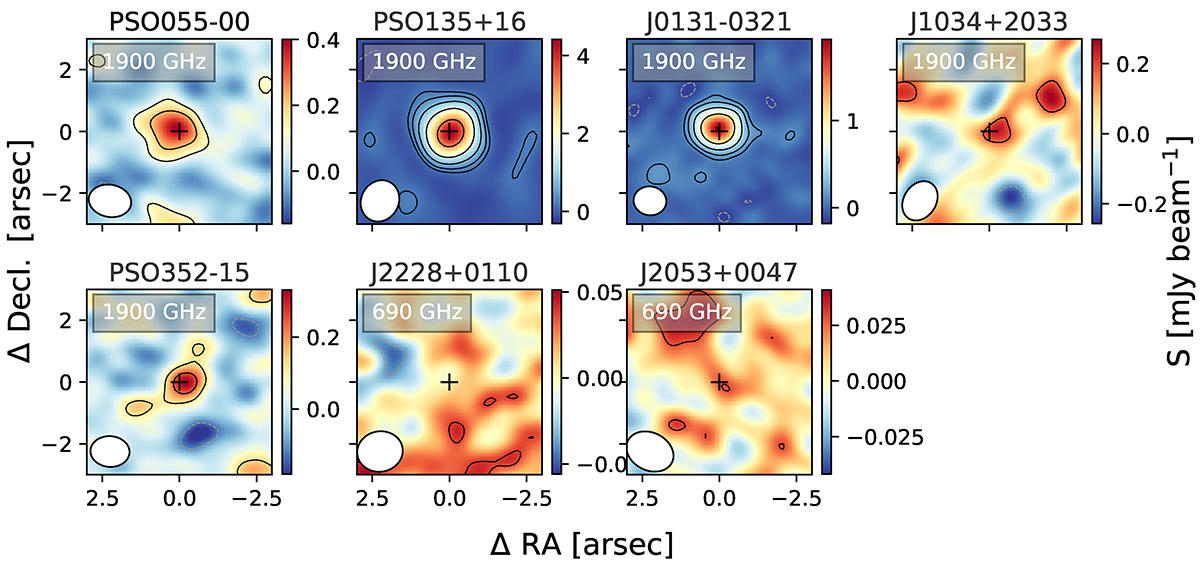
Fig. 4.
Download original image
ALMA continuum emission maps at rest-frame 1900 GHz (Band 7) and 690 GHz (Band 3). The black solid and dashed grey contours indicate the ±2, 4, 8..σ levels. We show the synthesized beam in white in the left bottom of each panel. The rest-frame UV/optical position of the quasar is reported with a black cross. The continuum emission is not detected in J2228+0110 nor in J2053+0047.
Current usage metrics show cumulative count of Article Views (full-text article views including HTML views, PDF and ePub downloads, according to the available data) and Abstracts Views on Vision4Press platform.
Data correspond to usage on the plateform after 2015. The current usage metrics is available 48-96 hours after online publication and is updated daily on week days.
Initial download of the metrics may take a while.