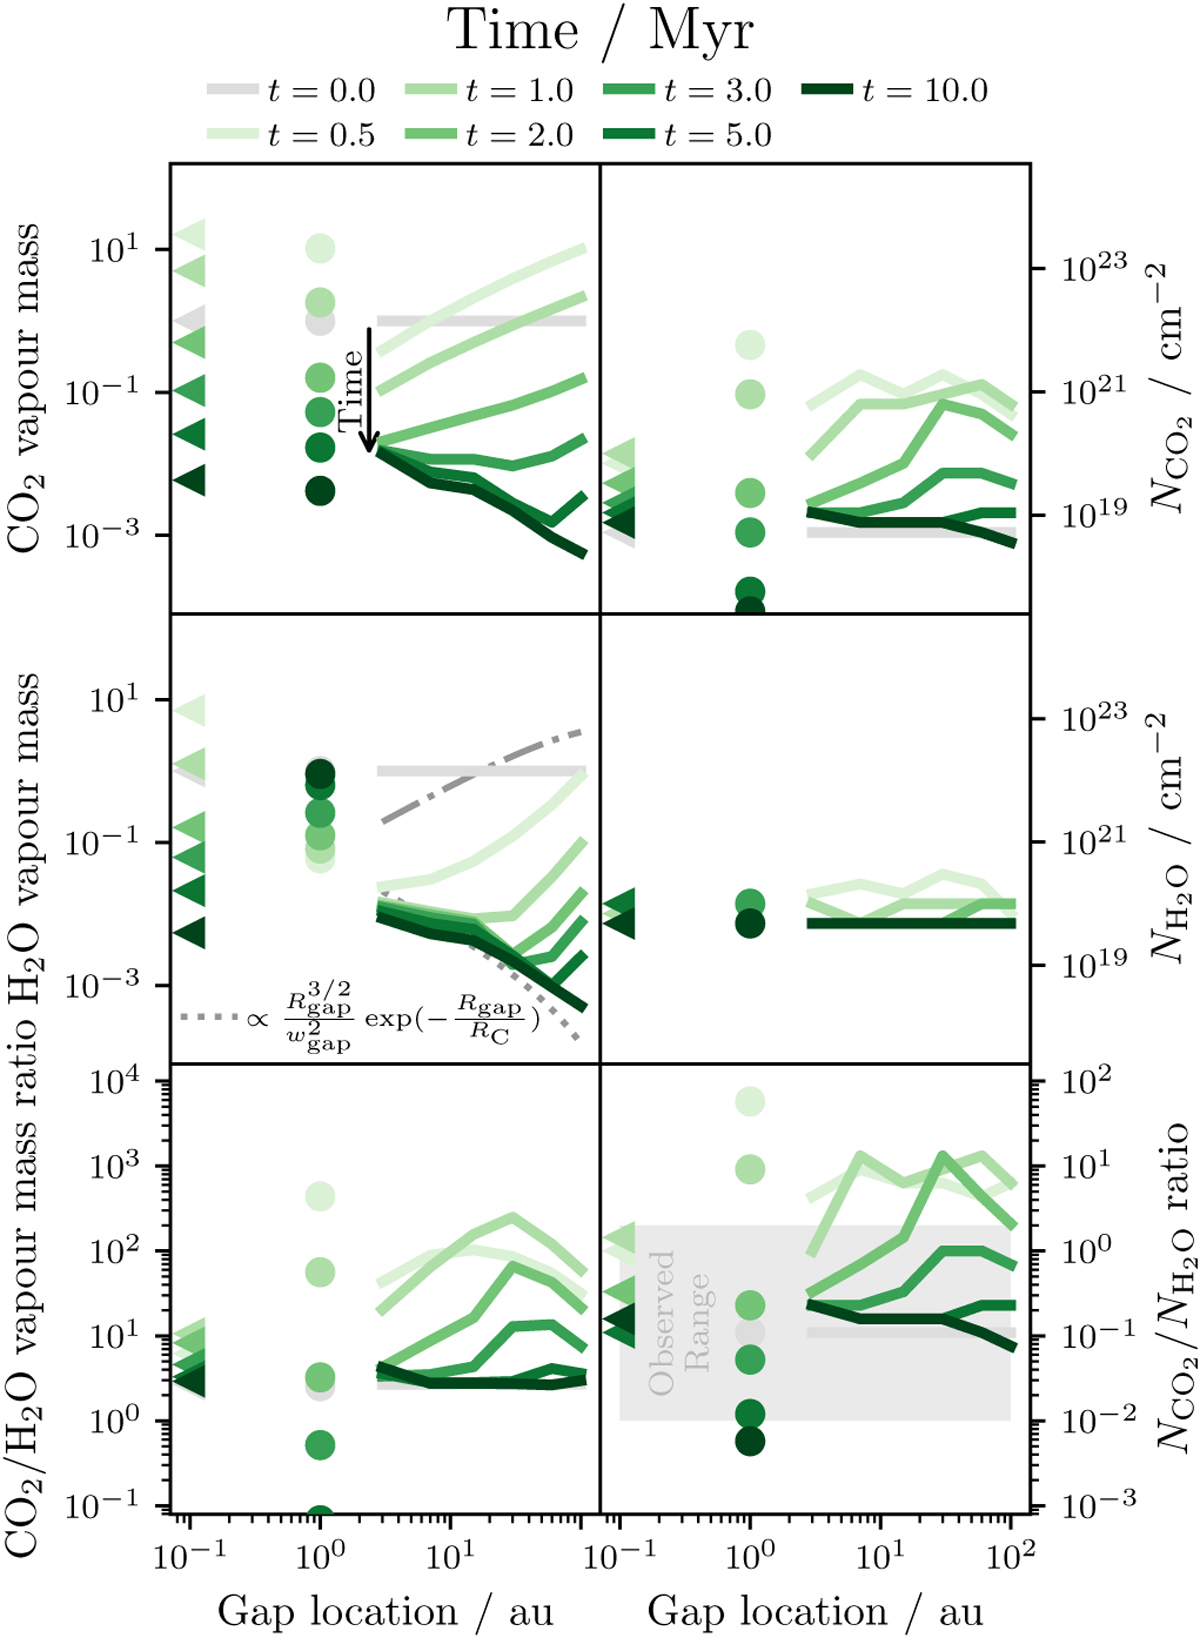
Fig. 9
Download original image
Trends of CO2 (top) and H2O (middle) vapour masses (left) and column densities (right) and their ratio (bottom) with Rgap at different stages of evolution for discs with traffic jams inside the water snow line (Scenario 1). The initial condition is in grey, while increasingly dark shades of green correspond to increasingly late times. The model with Rgap = 1 au is plotted separately at the dots as its gap is located very close to the H2O snow line and thus inside the CO2 snow line. A smooth disc model is included for comparison as the triangles. Equations (23) (dashed-dotted) and (11) (dotted) are plotted as guides to the eye the trends for approximate trends at early and late times.
Current usage metrics show cumulative count of Article Views (full-text article views including HTML views, PDF and ePub downloads, according to the available data) and Abstracts Views on Vision4Press platform.
Data correspond to usage on the plateform after 2015. The current usage metrics is available 48-96 hours after online publication and is updated daily on week days.
Initial download of the metrics may take a while.