Fig. 8
Download original image
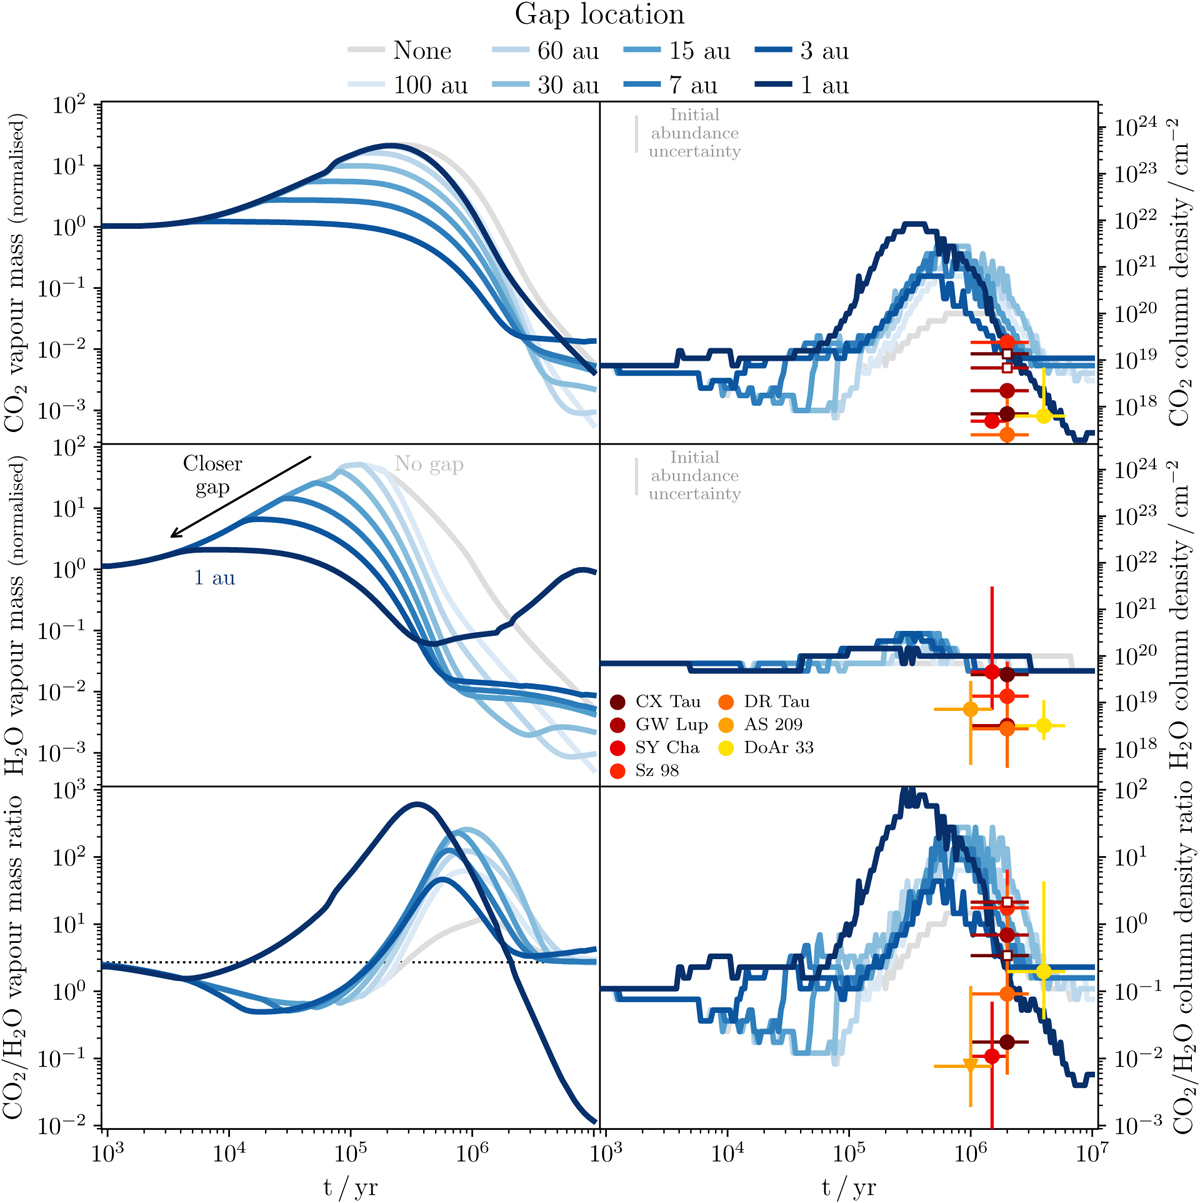
Evolution of the vapour mass (left) and column density (right) for CO2 (top row), H2O (middle row), and their ratio (bottom row) for discs with traffic jams inside the water snow line (Scenario 1). The grey line represents a smooth disc with no traps, while the blues lines, in order of increasingly dark shade, represent traps with increasingly close in traps. Overplotted at their approximate age are the results of slab model fits for a few discs from the literature: CX Tau (Vlasblom et al. 2025), GW Lup (Grant et al. 2023), SY Cha (Schwarz et al. 2024), Sz 98 (Gasman et al. 2023), DR Tau (Temmink et al. 2024b,a), AS 209 (Romero-Mirza et al. 2024b) and DoAr 33 (Colmenares et al. 2024), ordered by increasing stellar mass (more yellow colours). The open squares indicate an alternative estimate obtained from the 13CO2 isotopologue. The grey bar in the top left shows the ± log10(2.5) uncertainty depending on the basis used for the initial ice abundances (Sect. 2.3.2).
Current usage metrics show cumulative count of Article Views (full-text article views including HTML views, PDF and ePub downloads, according to the available data) and Abstracts Views on Vision4Press platform.
Data correspond to usage on the plateform after 2015. The current usage metrics is available 48-96 hours after online publication and is updated daily on week days.
Initial download of the metrics may take a while.