Open Access
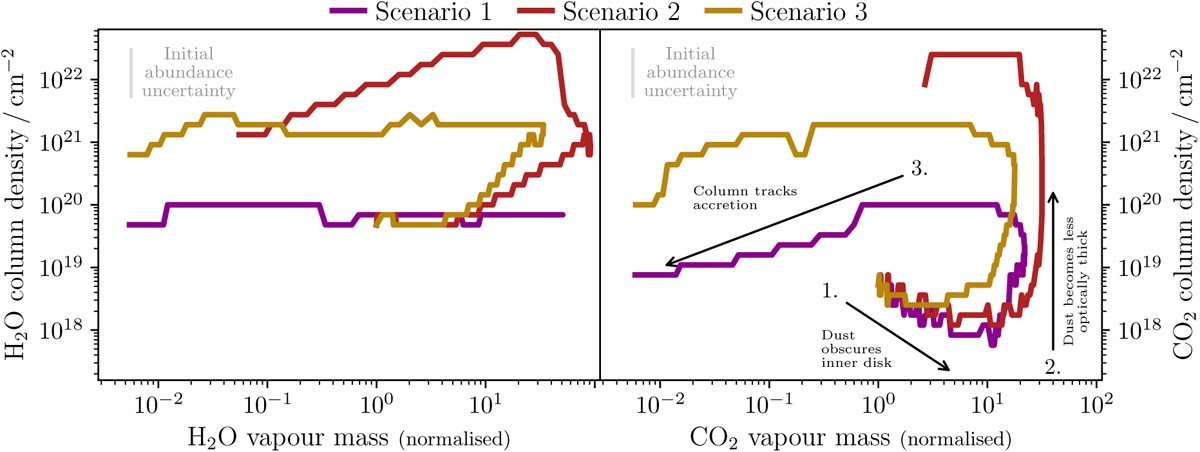
Fig. 7
Download original image
Relationships between the vapour mass and the column density measured using slab fits for H2O (left) and CO2 (right) for a smooth disc model in Scenarios 1 (purple), 2 (gold), and 3 (red). The curves shown are traversed anticlockwise.
Current usage metrics show cumulative count of Article Views (full-text article views including HTML views, PDF and ePub downloads, according to the available data) and Abstracts Views on Vision4Press platform.
Data correspond to usage on the plateform after 2015. The current usage metrics is available 48-96 hours after online publication and is updated daily on week days.
Initial download of the metrics may take a while.