Fig. 6
Download original image
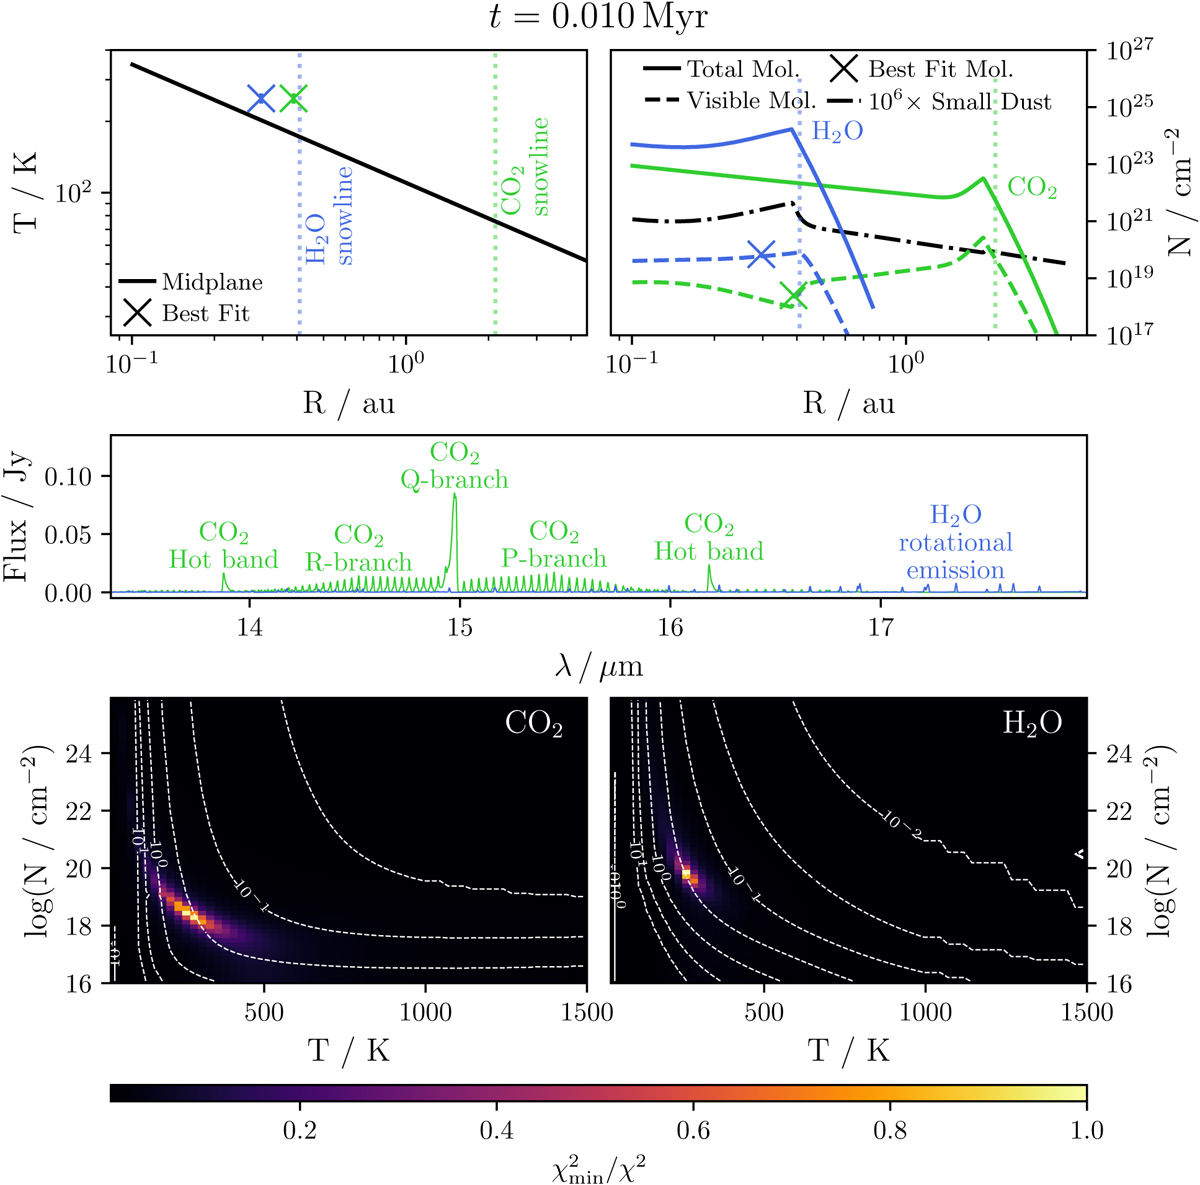
Example of the construction of a synthetic spectrum and the retrieval of parameters using 0D LTE slab model fits. The top panels show the temperature profile (left) and the column density profiles after 104 yr (right) for small dust (black) and total (solid) and visible (dashed) H2O (blue) and CO2 (green). The light, vertical, dotted lines indicate the snow lines. The middle panel shows the synthetic spectra of each molecule (assuming a distance of 140 pc) while the bottom panels show the goodness of fit for a grid of slab models with varying temperature and column density. The white contours show the radius (in AU) of a circle whose area maximises the goodness of fit for each combination of temperature and column density. The overall best fit parameters are shown on the top panels as the crosses, with the vertical error bars representing the spacing of the grid of slab models.
Current usage metrics show cumulative count of Article Views (full-text article views including HTML views, PDF and ePub downloads, according to the available data) and Abstracts Views on Vision4Press platform.
Data correspond to usage on the plateform after 2015. The current usage metrics is available 48-96 hours after online publication and is updated daily on week days.
Initial download of the metrics may take a while.