Fig. 5
Download original image
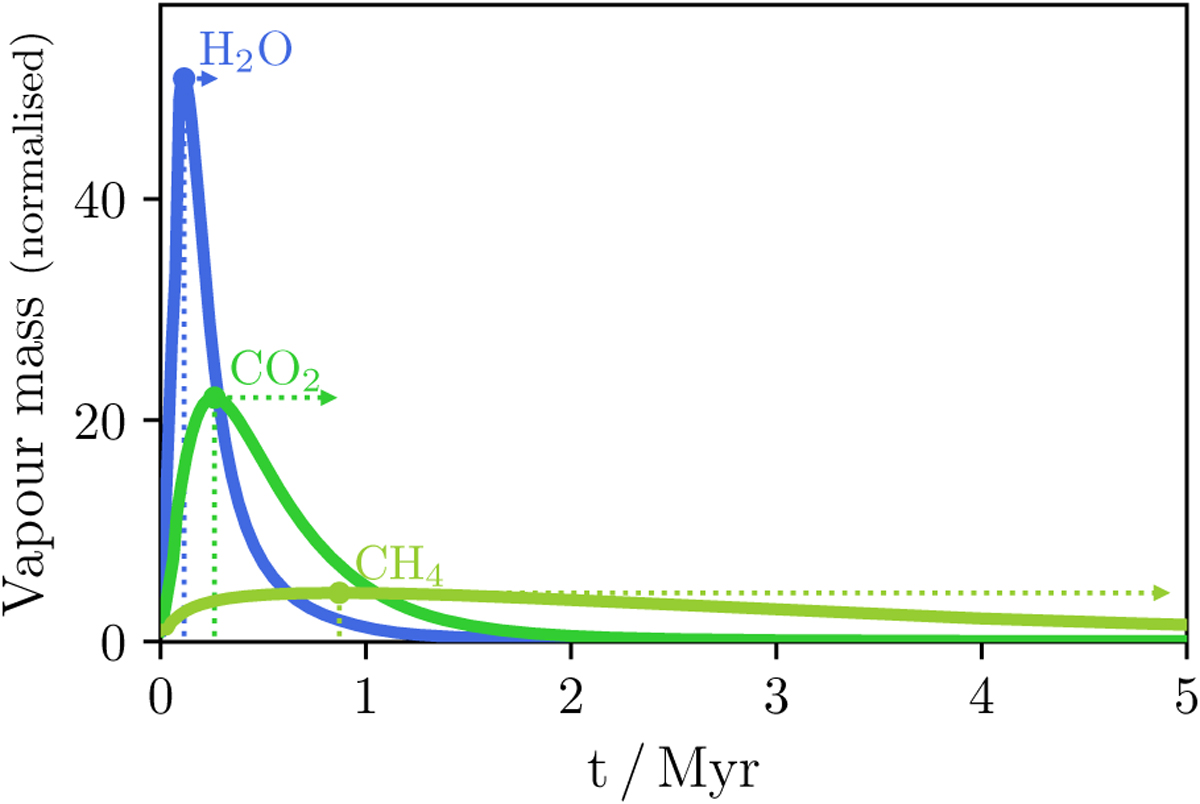
Evolution of the vapour mass of H2O (blue), CO2 (bright green), and CH4 (olive green) normalised to their initial values for a smooth disc in Scenario 1. The vertical dotted lines mark the times that each molecule reaches its peak vapour mass and the rightward arrows indicate the timescale for the peak to then decrease (Eq. (19)).
Current usage metrics show cumulative count of Article Views (full-text article views including HTML views, PDF and ePub downloads, according to the available data) and Abstracts Views on Vision4Press platform.
Data correspond to usage on the plateform after 2015. The current usage metrics is available 48-96 hours after online publication and is updated daily on week days.
Initial download of the metrics may take a while.