Fig. 2
Download original image
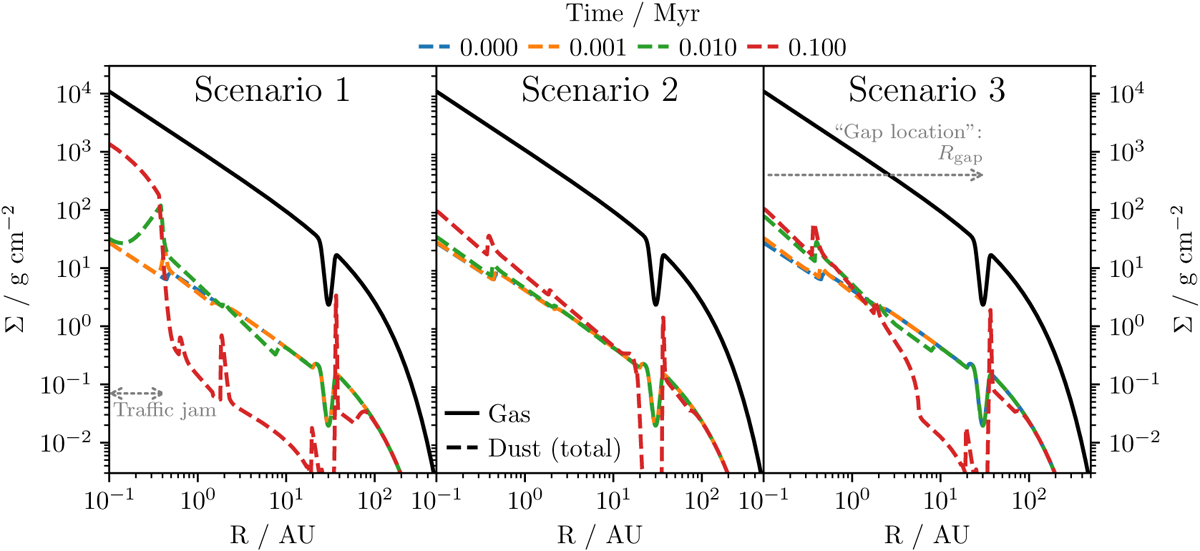
Example surface density profiles of gas (solid, initial value only) and (small+large) dust (dashed, at different times) for each of the three scenarios, illustrating the changing dust surface density distribution due to radial drift. The dip in the gas surface density signifies the gap, in this case at Rgap = 30 au and after 0.1 Myr (red), dust has begun to accumulate in the trap at its outer edge. The traffic jam that occurs in Scenario 1 can be seen in the steep rise in the dust surface density after 0.1 Myr inside the water snow line at ≈0.4 au. The other small steps correspond to changes in the solid fraction at snow lines and the smaller bumps are the accumulation of ices at snow lines due to the cold finger effect.
Current usage metrics show cumulative count of Article Views (full-text article views including HTML views, PDF and ePub downloads, according to the available data) and Abstracts Views on Vision4Press platform.
Data correspond to usage on the plateform after 2015. The current usage metrics is available 48-96 hours after online publication and is updated daily on week days.
Initial download of the metrics may take a while.