Fig. 1
Download original image
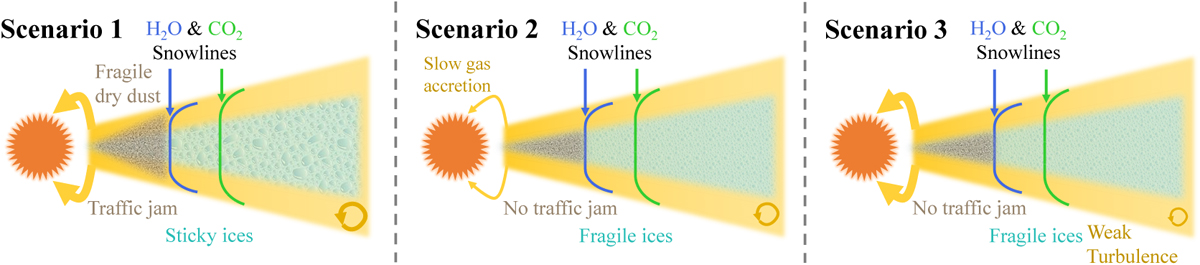
Cartoon depicting the three scenarios explored in this work. The thickness of the yellow arrows connecting the disc and star represents the magnitude of α controlling the gas evolution and accretion. The turbulence strength is indicated by the thickness and size of the circular arrow in the bottom right. The speckled region represents the dust with the brown colour indicating dry dust and the light blue colour indicating icy dust and the finer-grained pattern indicating where grains are more fragile. The vertical size of this region is inflated for illustrative purposes in locations where is a traffic jam and grains pile up.
Current usage metrics show cumulative count of Article Views (full-text article views including HTML views, PDF and ePub downloads, according to the available data) and Abstracts Views on Vision4Press platform.
Data correspond to usage on the plateform after 2015. The current usage metrics is available 48-96 hours after online publication and is updated daily on week days.
Initial download of the metrics may take a while.