Fig. 4
Download original image
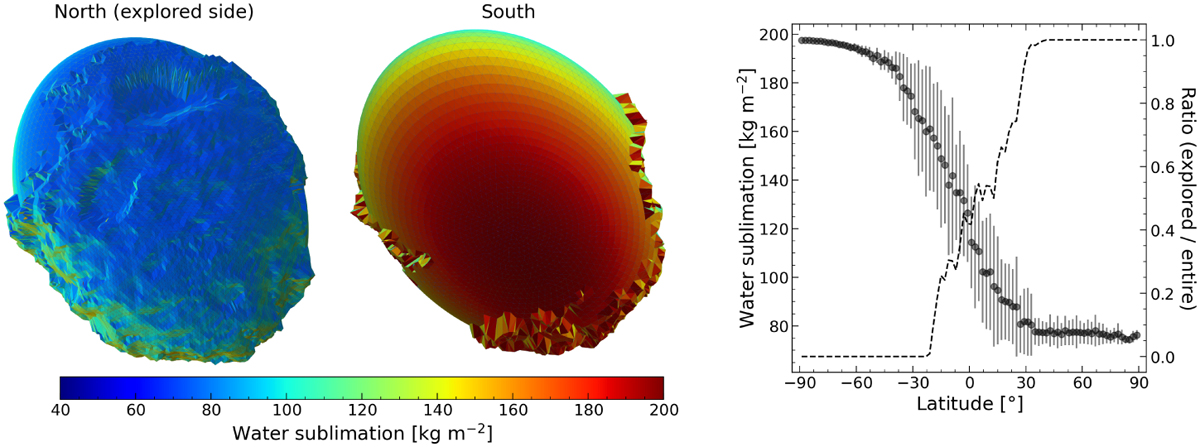
Orbit-integrated water production rates of 81P. (left) Surface distribution of water production. The left and right figures preferentially show the explored northern and the unexplored southern side, respectively. (right) Latitudinal-dependent water production. The filled circles and the error bars show average sublimation rates and standard deviations of the facets inside the latitudinal bin. The dotted line shows the fraction of the explored side with respect to the entire surface inside the latitudinal bin.
Current usage metrics show cumulative count of Article Views (full-text article views including HTML views, PDF and ePub downloads, according to the available data) and Abstracts Views on Vision4Press platform.
Data correspond to usage on the plateform after 2015. The current usage metrics is available 48-96 hours after online publication and is updated daily on week days.
Initial download of the metrics may take a while.