Fig. 3
Download original image
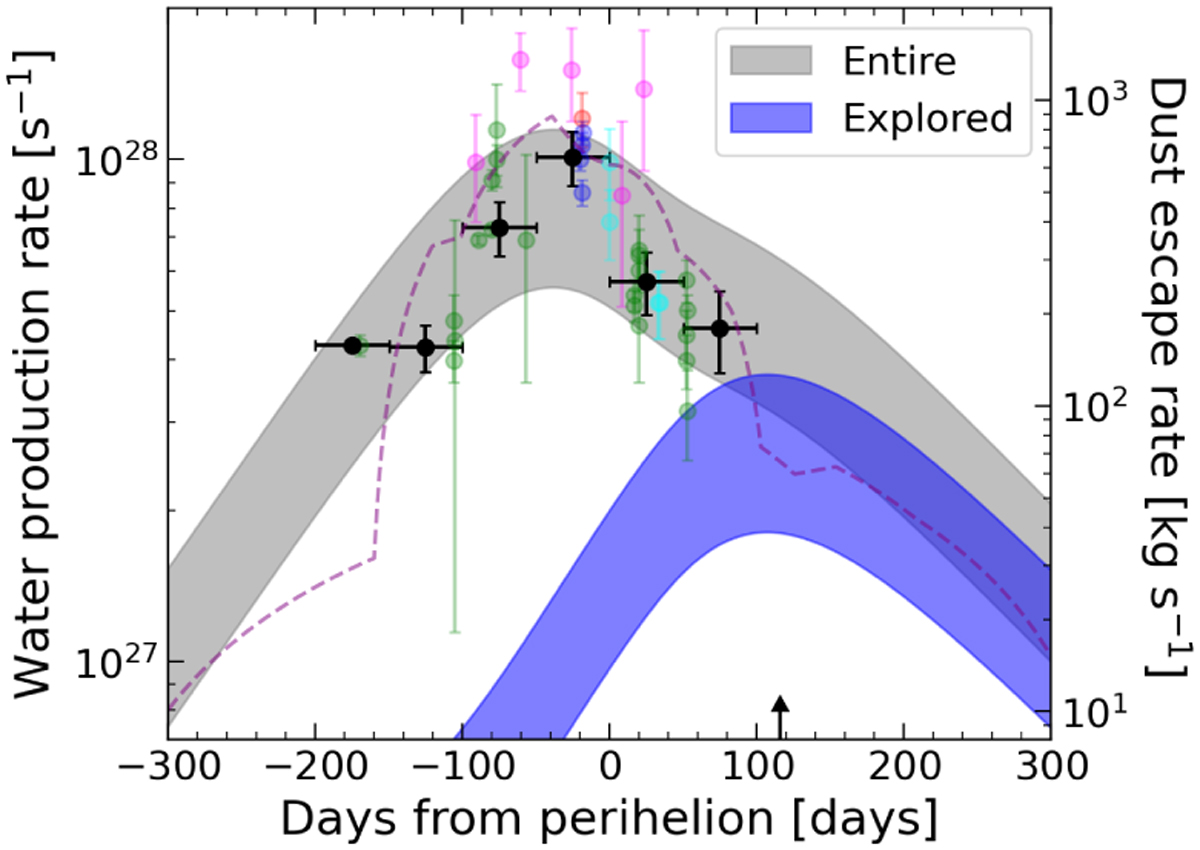
Seasonal water production rate of 81P scaled with observational data. The red, green, blue, magenta, and cyan points show the observational data from previous studies, and the black-filled circles are the average data within the 50-day bin (Table A.1). The gray and blue-filled regions represent the possible ranges of the water production rates from the entire surface (gray) and from only the explored side (blue), respectively, which is scaled by the average data. The dotted line shows the dust escape rates adopted from Pozuelos et al. (2014a). The black arrow indicates the day on which Stardust encountered 81P.
Current usage metrics show cumulative count of Article Views (full-text article views including HTML views, PDF and ePub downloads, according to the available data) and Abstracts Views on Vision4Press platform.
Data correspond to usage on the plateform after 2015. The current usage metrics is available 48-96 hours after online publication and is updated daily on week days.
Initial download of the metrics may take a while.