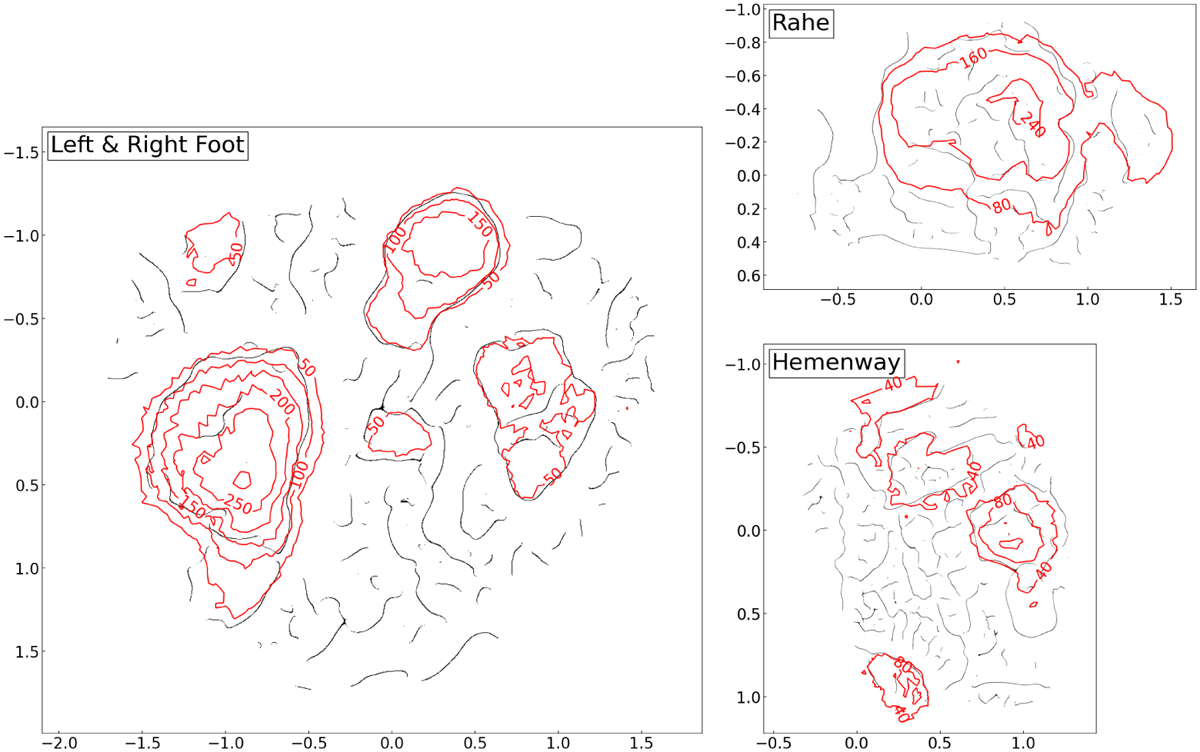
Fig. 2
Download original image
Depressions were detected in three regions: Left foot & right foot, Rahe, and Hemenway. The black solid lines show the results of the edge detection technique. The red contours indicate the relative elevation labeled with depth (m). The outermost contours of each region represent the borders of the detected depressions. The x- and y-axes of each region are projected distances (km). In each plot, the horizontal and vertical axes indicate arbitrary Cartesian coordinates on the triaxial ellipsoid surface.
Current usage metrics show cumulative count of Article Views (full-text article views including HTML views, PDF and ePub downloads, according to the available data) and Abstracts Views on Vision4Press platform.
Data correspond to usage on the plateform after 2015. The current usage metrics is available 48-96 hours after online publication and is updated daily on week days.
Initial download of the metrics may take a while.