Fig. 1
Download original image
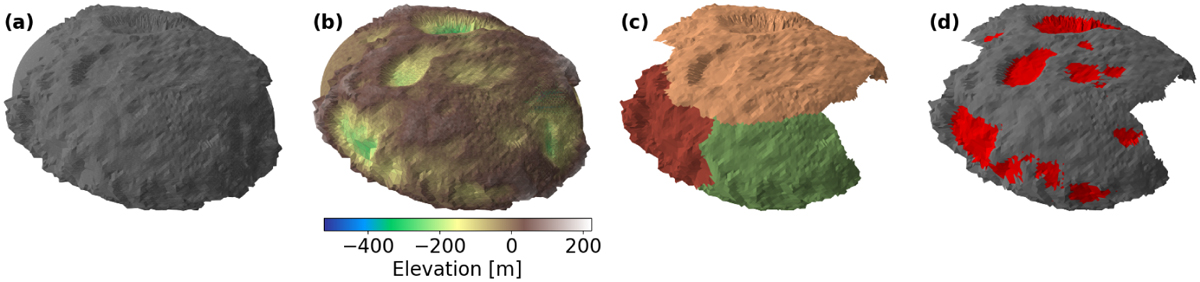
Schematic process to calculate depression volumes in this study. (a) Shape model of 81P used in this study. The unexplored side is extrapolated to the fit ellipsoid. (b) Elevation map of 81P. (c) Three defined regions of the explored side: left foot & right foot (orange), Rahe (red), and Hemenway (green). (d) Depressions extracted by the edge detection technique (same as the outermost contours in Fig. 2).
Current usage metrics show cumulative count of Article Views (full-text article views including HTML views, PDF and ePub downloads, according to the available data) and Abstracts Views on Vision4Press platform.
Data correspond to usage on the plateform after 2015. The current usage metrics is available 48-96 hours after online publication and is updated daily on week days.
Initial download of the metrics may take a while.