Fig. 8
Download original image
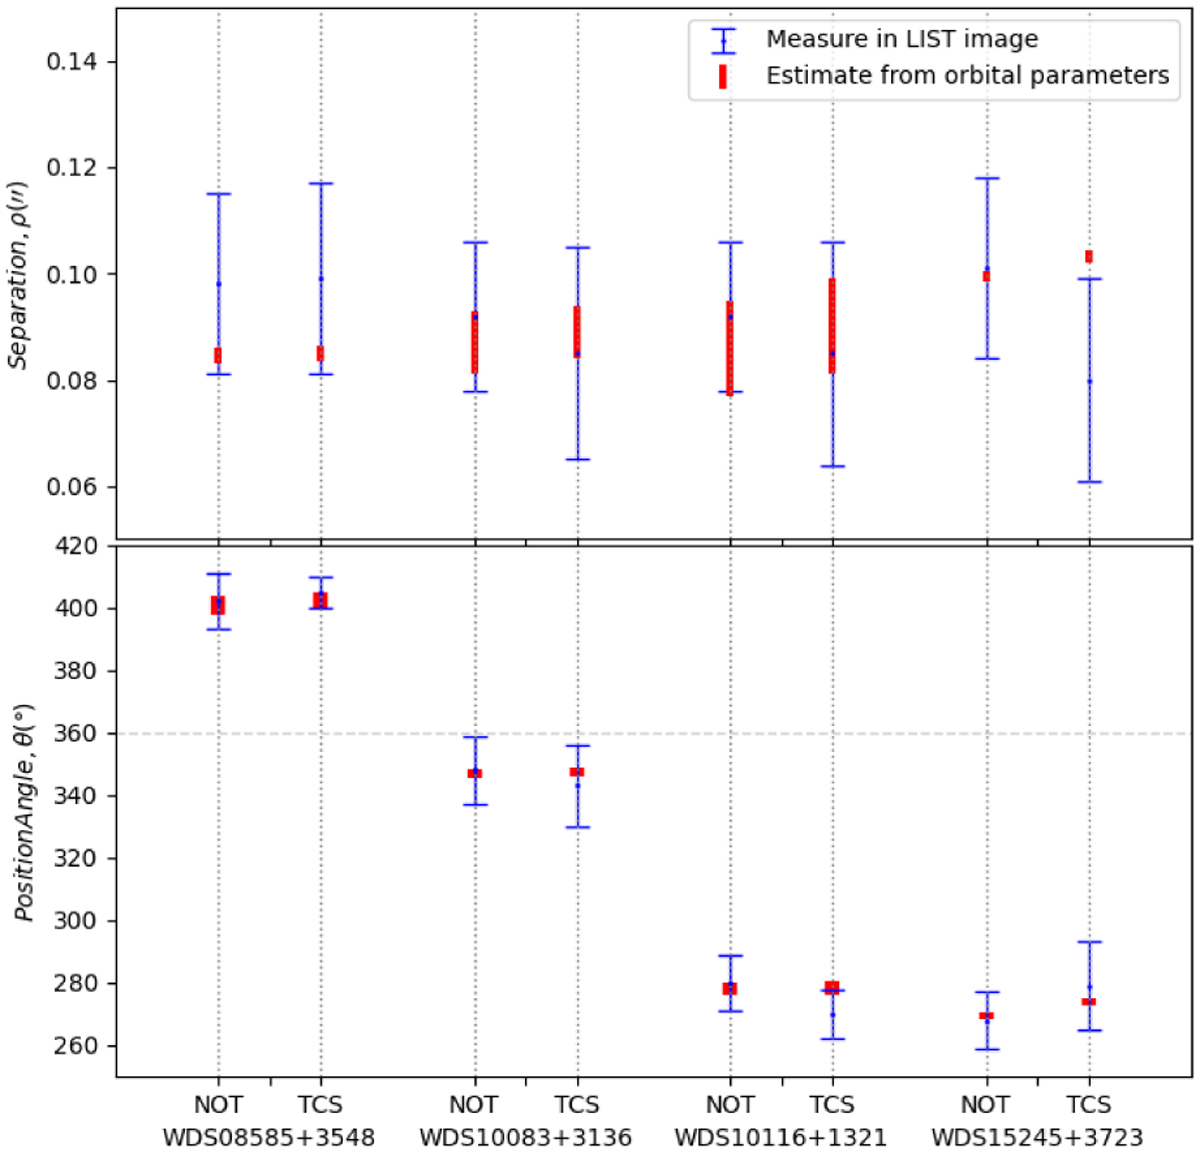
Comparison of the ephemeris values measured in the LIST images (blue) with those calculated from the known orbital parameters (red). The top plot represents the projected separation variable, while the bottom plot represents the positional angle between the two components. For clarity, 360 degrees have been added for the first object. On the x-axis, each of the binaries and the telescopes used for the observations are specified.
Current usage metrics show cumulative count of Article Views (full-text article views including HTML views, PDF and ePub downloads, according to the available data) and Abstracts Views on Vision4Press platform.
Data correspond to usage on the plateform after 2015. The current usage metrics is available 48-96 hours after online publication and is updated daily on week days.
Initial download of the metrics may take a while.