Fig. 5
Download original image
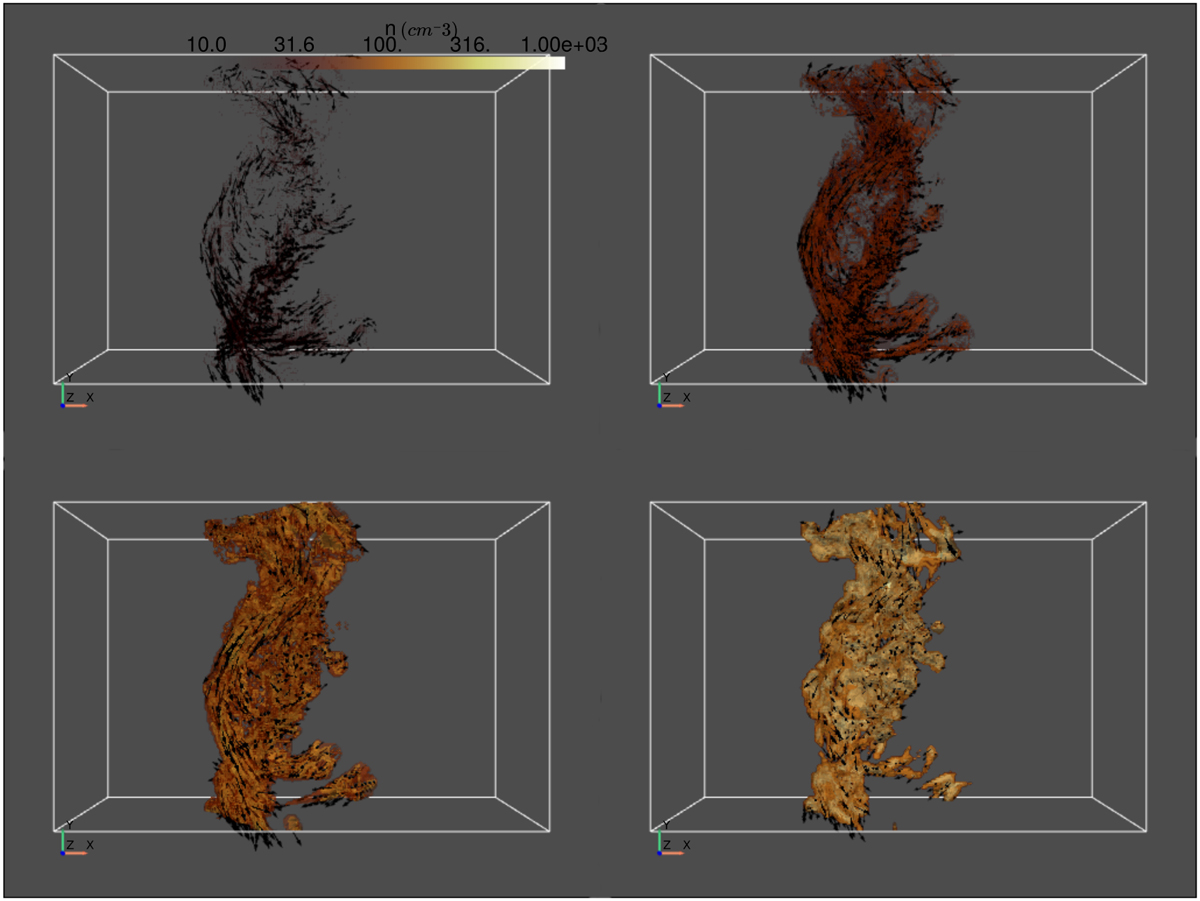
Regions used to compute the HRO diagram and the shape parameter shown in Fig. 4. The yellow surfaces are density isocountours and the dark arrows represent the magnetic field. The top-left panel corresponds to gas with density n ∈ [10, 30] cm−3, top-right panel to n ∈ [30, 100] cm−3, bottom-left to n ∈ [100, 300] cm−3, and bottom-right to n ∈ [300, 1000] cm−3. It can be seen that for the four density intervals shown here, the magnetic field is noticeably parallel to the density structures. However, the magnetic field shows a deviation from this trend for the highest density interval in the bottom right panel. The associated movie is available online.
Current usage metrics show cumulative count of Article Views (full-text article views including HTML views, PDF and ePub downloads, according to the available data) and Abstracts Views on Vision4Press platform.
Data correspond to usage on the plateform after 2015. The current usage metrics is available 48-96 hours after online publication and is updated daily on week days.
Initial download of the metrics may take a while.