Fig. 4
Download original image
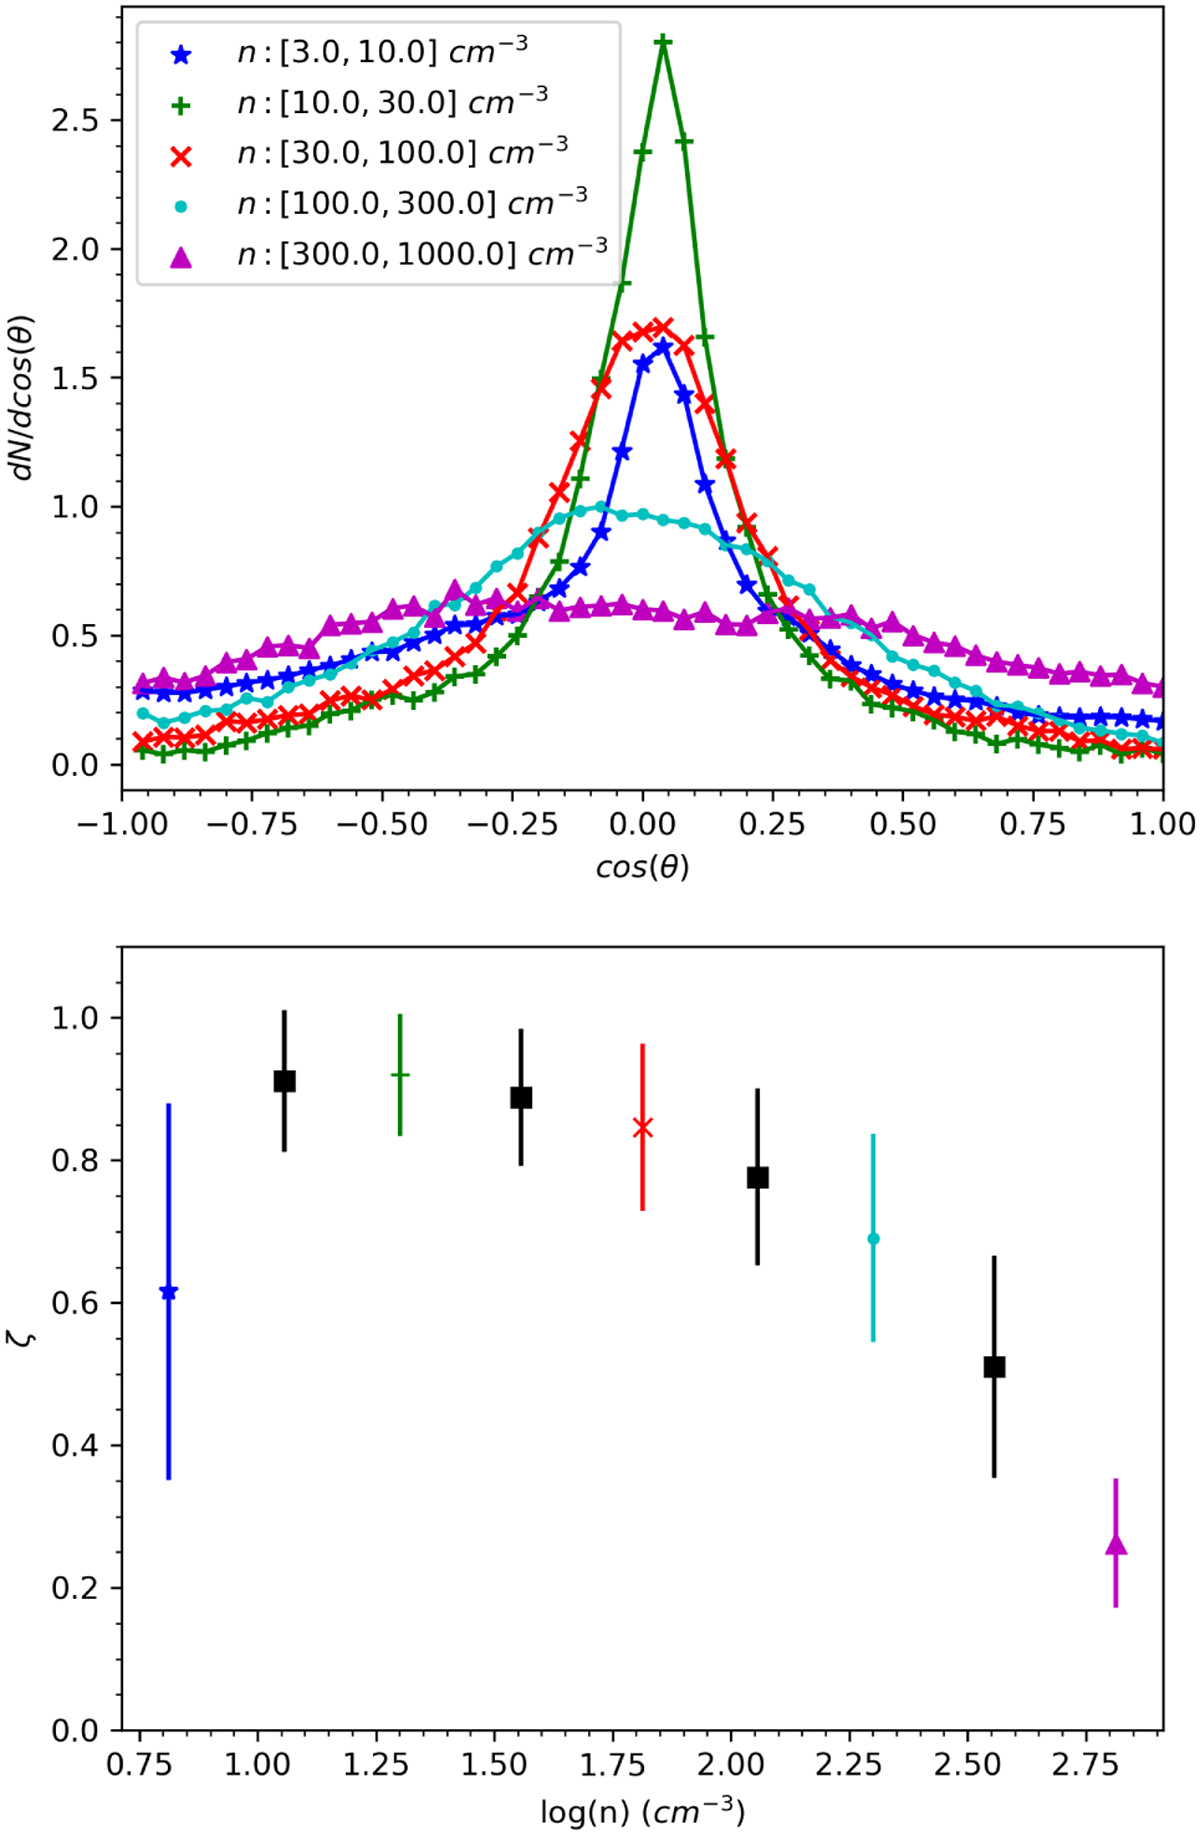
Statistics of the relative orientation of the magnetic field and density structures for the 3D simulation. Top: HRO diagram computed at 5 Myr for four different number density intervals. Bottom: shape parameter (see Eq. (4.3)) versus number density, where the error bars were computed using Eq. (5) of Planck Collaboration Int. XXXV (2016). In this panel, shape parameter values in black squares are not shown in the HRO at the top panel. It can be seen that the magnetic field is increasingly parallel over the first three intervals, but then the parallel relative orientation decreases towards higher densities.
Current usage metrics show cumulative count of Article Views (full-text article views including HTML views, PDF and ePub downloads, according to the available data) and Abstracts Views on Vision4Press platform.
Data correspond to usage on the plateform after 2015. The current usage metrics is available 48-96 hours after online publication and is updated daily on week days.
Initial download of the metrics may take a while.