Fig. 10
Download original image
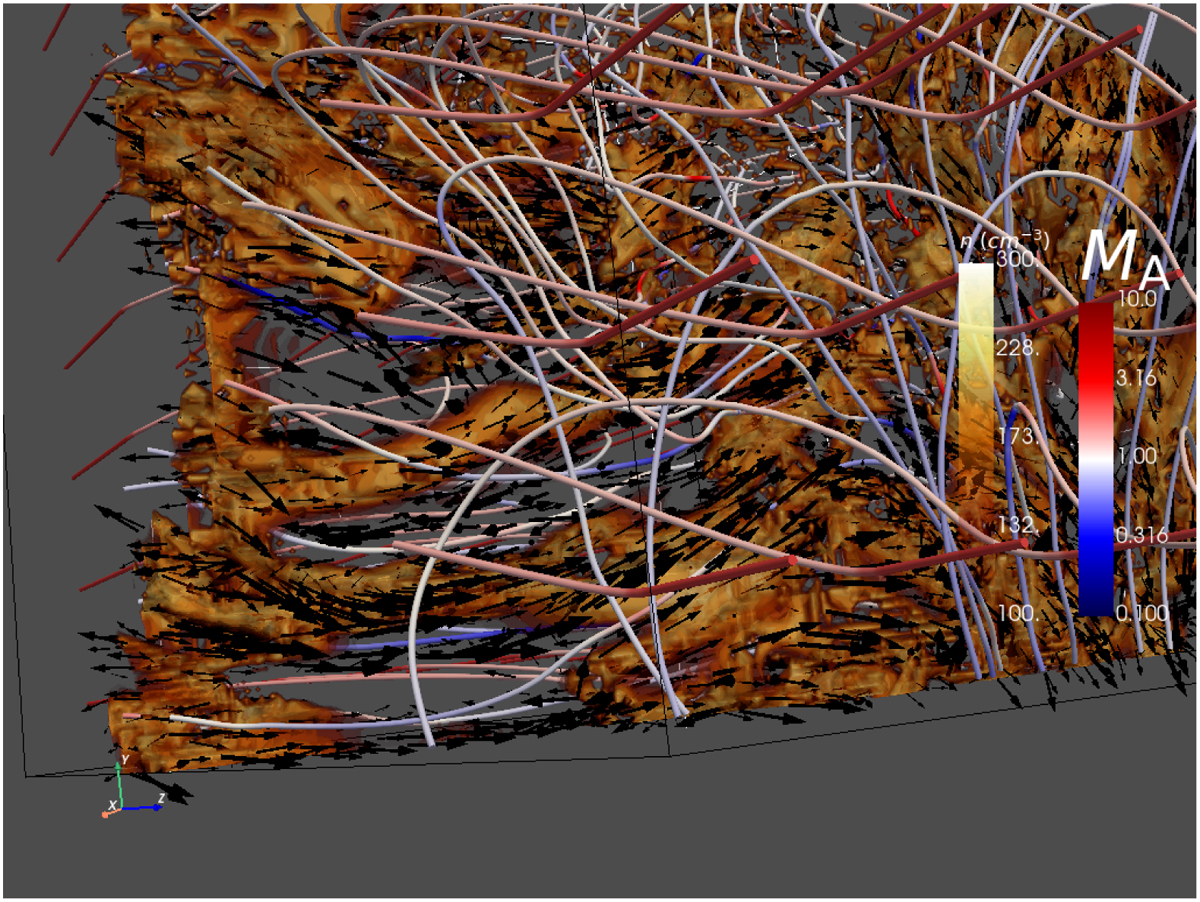
Couple of filamentary CNM clouds located in the bottom-left corner. This 3D visualization also corresponds to R1 after 5 Myr of evolution. In the provided animation showing this region, it can be seen a turbulent shear strain velocity field along their main axis and aligned with the local magnetic field. Note: the velocity field on the filamentary CNM clouds is different from the one expected in the case of the NTSI. The associated movie is available online.
Current usage metrics show cumulative count of Article Views (full-text article views including HTML views, PDF and ePub downloads, according to the available data) and Abstracts Views on Vision4Press platform.
Data correspond to usage on the plateform after 2015. The current usage metrics is available 48-96 hours after online publication and is updated daily on week days.
Initial download of the metrics may take a while.