Open Access
Fig. 1
Download original image
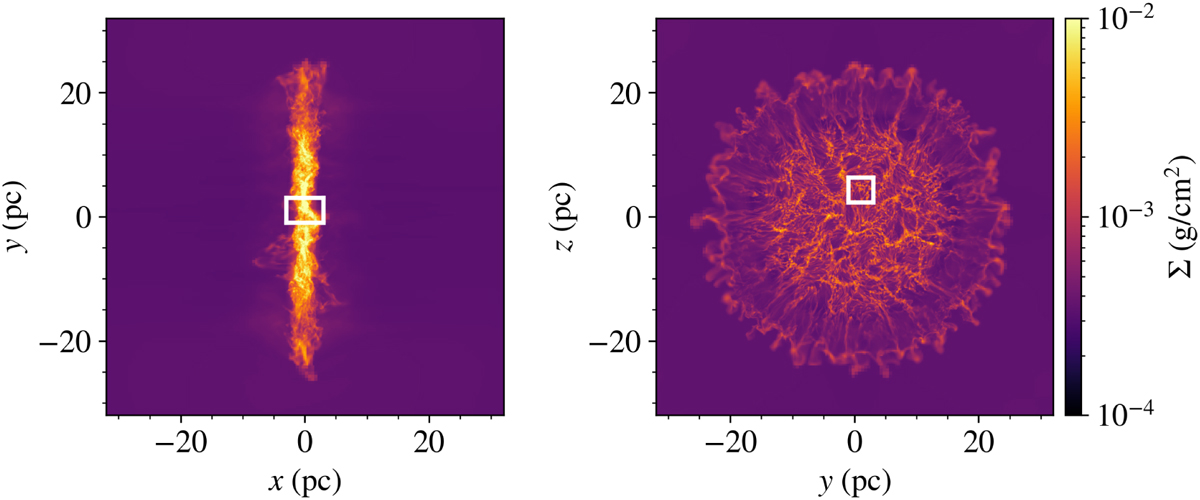
Column density of the CNM cloud’s simulation at 5 Myr. The highlighted region (R1) is examined in 3D in order to show the magnetic field and density morphology.
Current usage metrics show cumulative count of Article Views (full-text article views including HTML views, PDF and ePub downloads, according to the available data) and Abstracts Views on Vision4Press platform.
Data correspond to usage on the plateform after 2015. The current usage metrics is available 48-96 hours after online publication and is updated daily on week days.
Initial download of the metrics may take a while.