Open Access
Fig. 8
Download original image
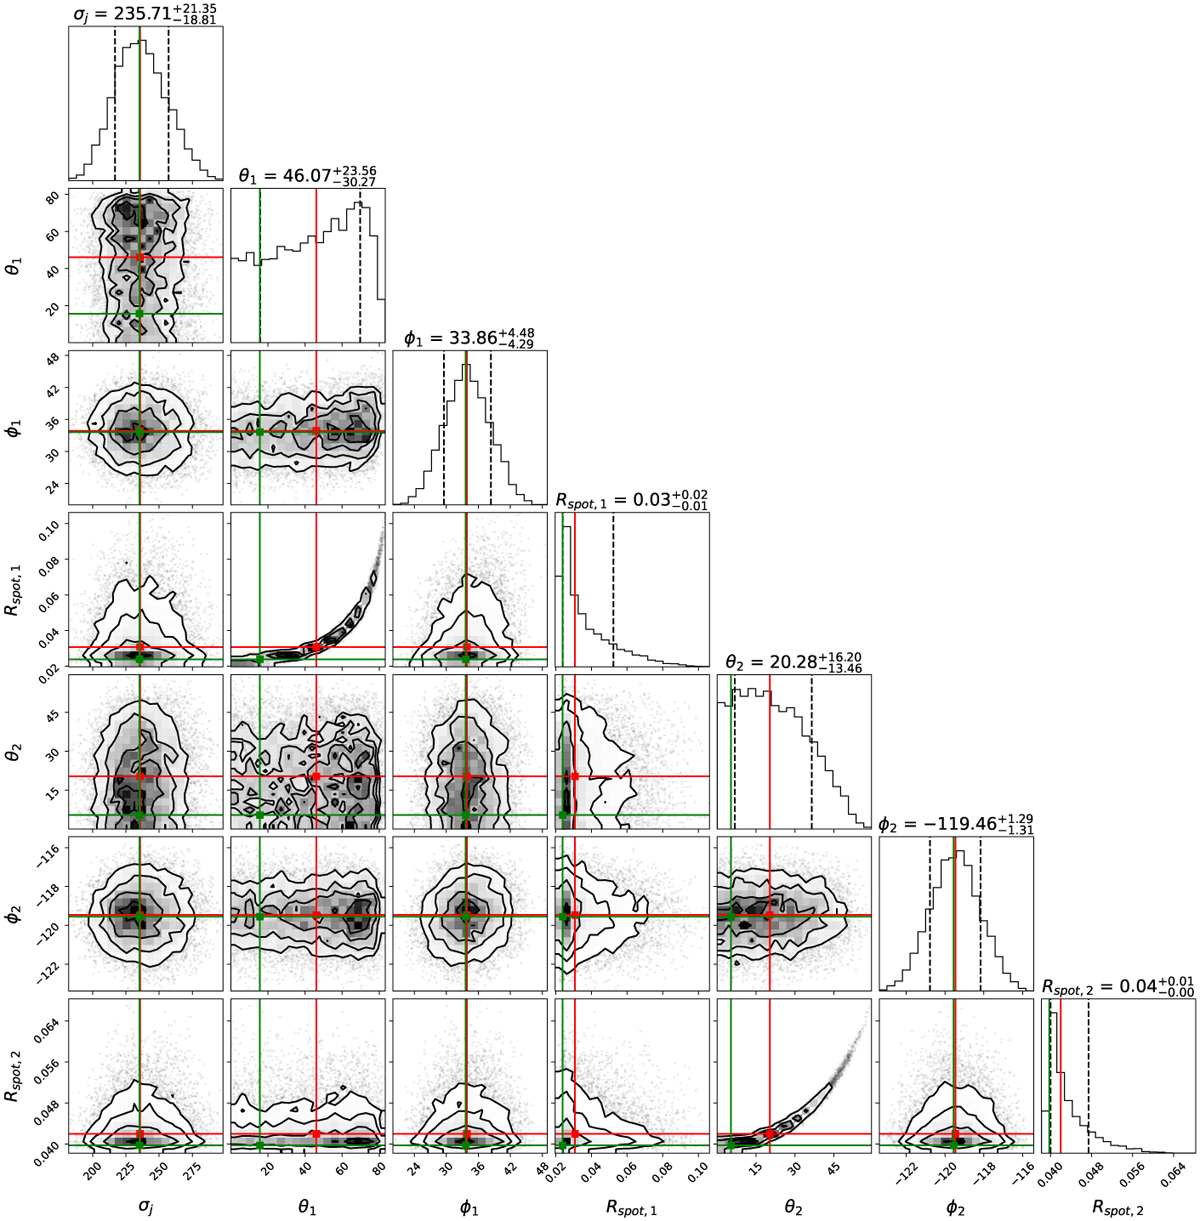
Posterior distribution of two-spot model. MAP solution is marked as a green line, while the median is marked as a red line. Dashed black lines in diagonal histograms mark, respectively, the 16th and 84th quantiles.
Current usage metrics show cumulative count of Article Views (full-text article views including HTML views, PDF and ePub downloads, according to the available data) and Abstracts Views on Vision4Press platform.
Data correspond to usage on the plateform after 2015. The current usage metrics is available 48-96 hours after online publication and is updated daily on week days.
Initial download of the metrics may take a while.