Fig. 5
Download original image
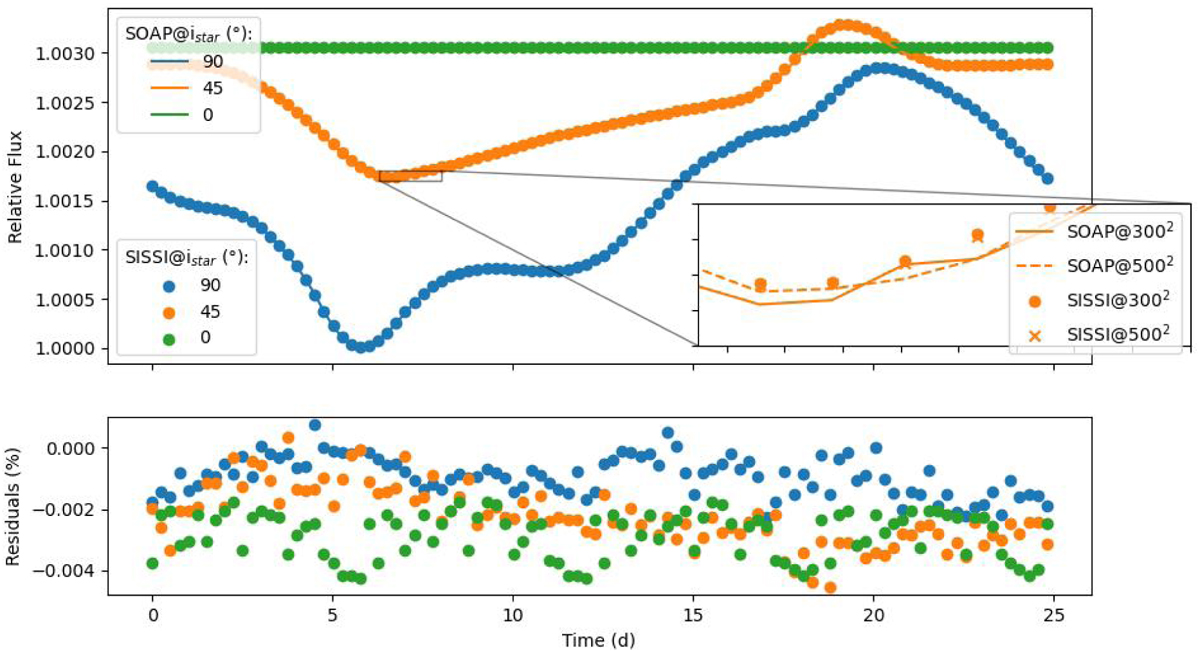
Top panel: comparison of SOAP forward model with respect ours, with, respectively, coloured lines marking the SOAP solutions and circles marking ours; parameters listed in Table 2 are used. The equatorial-on solution is presented in blue, an intermediate inclination of 45° is in orange, while the polar-on solution is presented in green. Fluxes have been normalised to the photospheric and unperturbed flux. An insert in the panel shows a comparison of the two models using different numbers of grid points to build the stellar surface. The insert follows the same notation of the main panel, but two profiles are added to mark the solution obtained using 5002 grid points in the case of the SOAP code (dashed line) and ours (x marker). Bottom panel: residuals of two models evaluated as (FSOAP − FPAStar)/FSOAP · 100, considering the lowest grid resolution.
Current usage metrics show cumulative count of Article Views (full-text article views including HTML views, PDF and ePub downloads, according to the available data) and Abstracts Views on Vision4Press platform.
Data correspond to usage on the plateform after 2015. The current usage metrics is available 48-96 hours after online publication and is updated daily on week days.
Initial download of the metrics may take a while.