Fig. 4
Download original image
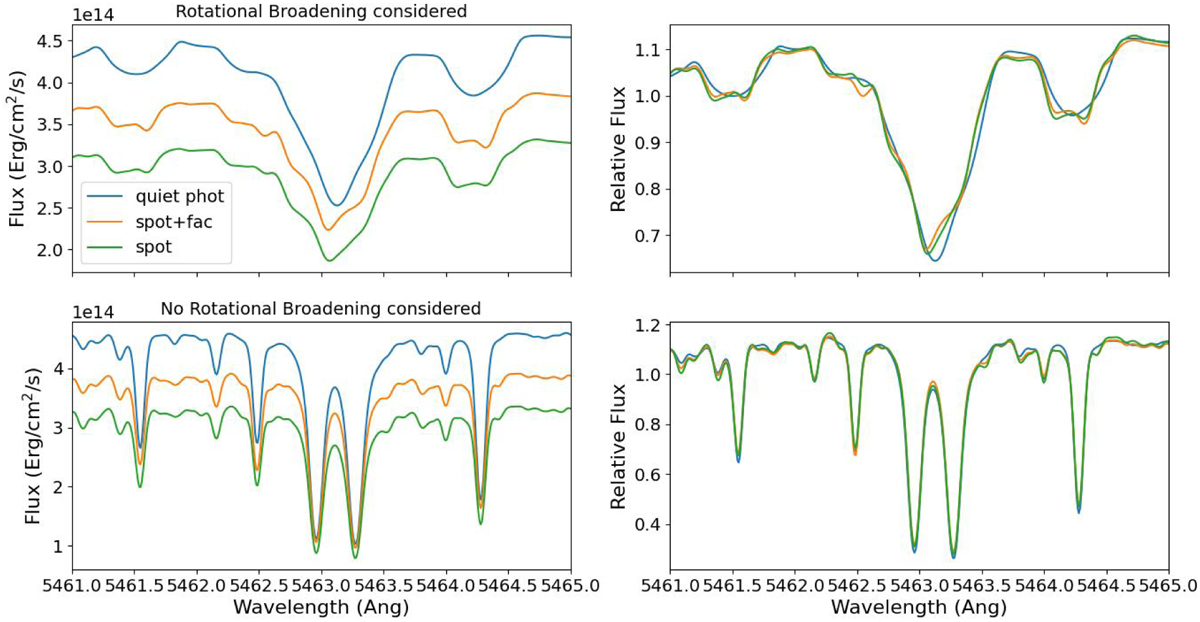
High-resolution spectra computed by the model. Top rows: broadened spectra by star rotation in the case of immaculate photosphere (blue), the complex activity scenario (orange), and the spots-only scenario (green). Bottom row: same as top rows, but without considering the rotational broadening in the computation. For comparison purposes, absolute fluxes (left panels) are presented together with the normalised ones (right). The normalisation trend has been evaluated with a Gaussian filter of 1200 Å as sigma.
Current usage metrics show cumulative count of Article Views (full-text article views including HTML views, PDF and ePub downloads, according to the available data) and Abstracts Views on Vision4Press platform.
Data correspond to usage on the plateform after 2015. The current usage metrics is available 48-96 hours after online publication and is updated daily on week days.
Initial download of the metrics may take a while.